
Figure 4. The mreBA53T allele confers a lag-phase growth advantage.
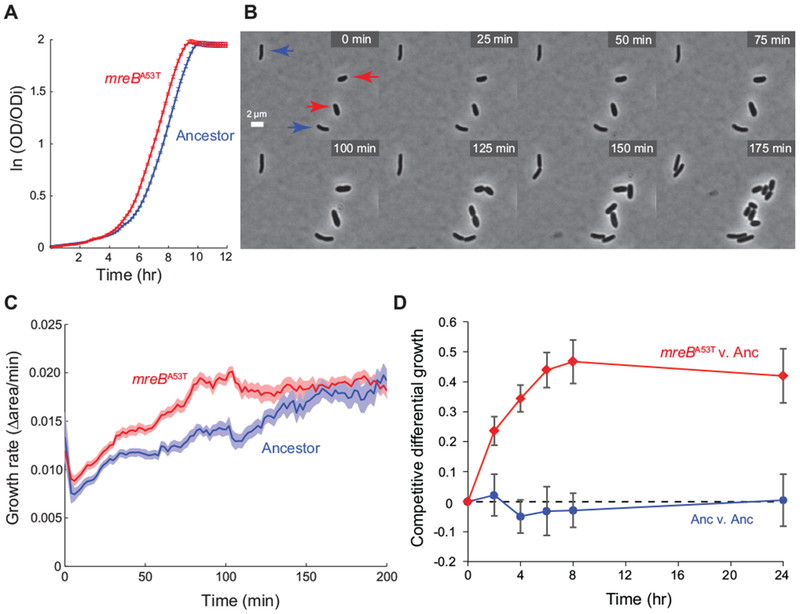
A) Population growth dynamics for the ancestor and the mreBA53T strain in Davis minimal medium plus glucose (DM+Glu). Optical density (OD) is normalized by the initial optical density (ODi). Errors represent standard error (n = 6). B) Time-lapse images of the mreBA53T strain and the ancestor transitioning from stationary phase to exponential growth in DM+Glu medium. Ancestral and mreBA53T genotypes were distinguished based on differences in cell width, which have well separated distributions (Fig. 1 & Table S1). Red arrows indicate mreBA53T cells and blue arrows indicate ancestral cells. C) Instantaneous growth rates of single cells transitioning from stationary phase to exponential growth on DM+Glu indicate a decrease in lag phase time for mreBA53T cells. Growth rates were calculated as the fractional increase in the two-dimensional projected area of the cell between frames. Shaded boundaries represent standard error (n = 20). D) Fine-scale analysis of differential growth for the mreBA53T strain competed against the ancestor in the Glu environment. Competitive differential growth represents the natural log difference in growth between competitors relative to their initial density. As a control, the ancestor was also competed against itself and showed no growth differences over the course of competition. Error bars represent standard error (n = 8).