
Figure 5. Scaling between cell geometry and fitness.
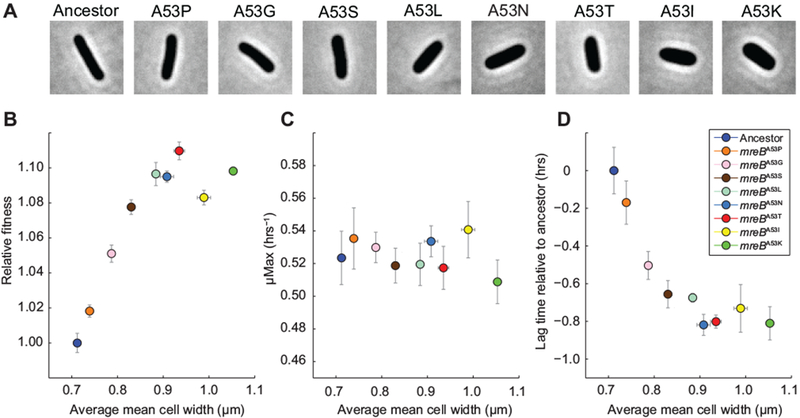
A) Phase-contrast images of mreBA53 mutants. B) Head-to-head fitness competitions between mreBA53 mutants and the ancestor were performed in the Glu environment. Estimates for relative fitness are the average of eight replicates across two independent experiments. Mean cell widths are the average of three independent estimates for each strain. Error bars for fitness and cell width measurements represent 95% CIs. C) Maximal growth rates of mreBA53 mutants and the ancestor in DM+Glu as function of cell width. Error bars represent 95% CIs (n = 8). D) Relative lag time of mreBA53 mutants in DM+Glu as a function of cell width. Error bars represent 95% CIs (n = 8).