
Figure 6. Environment -dependent fitness effect.
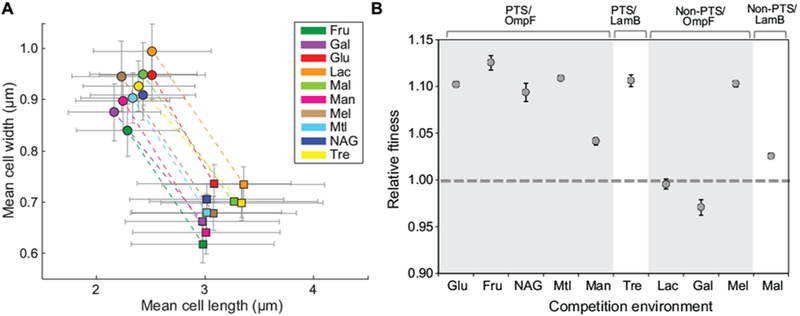
A) Morphology of the ancestor and mreBA53T mutant in DM media supplemented with different carbon sources. Environments: Glu (glucose), Fru (fructose), NAG (N-acetyl glucosamine), Man (mannose), Lac (lactose), Gal (galactose), Mel (melibiose), Mal (maltose), and Tre (trehalose). Average mean values for cell width and length distributions are plotted. Dashed lines connect strains imaged in the same environment. Error bars represent standard deviations of the population distributions; the ancestor is represented by square symbols and the mreBA53T strain by circular symbols. B) Head-to-head competitions were performed between the ancestor and the mreBA53T mutant strain in the same environments shown in (A). Estimates for relative fitness are the average of eight replicates analyzed across two independent experiments. The dashed line represents zero difference in fitness. Error bars represent 95% CIs.