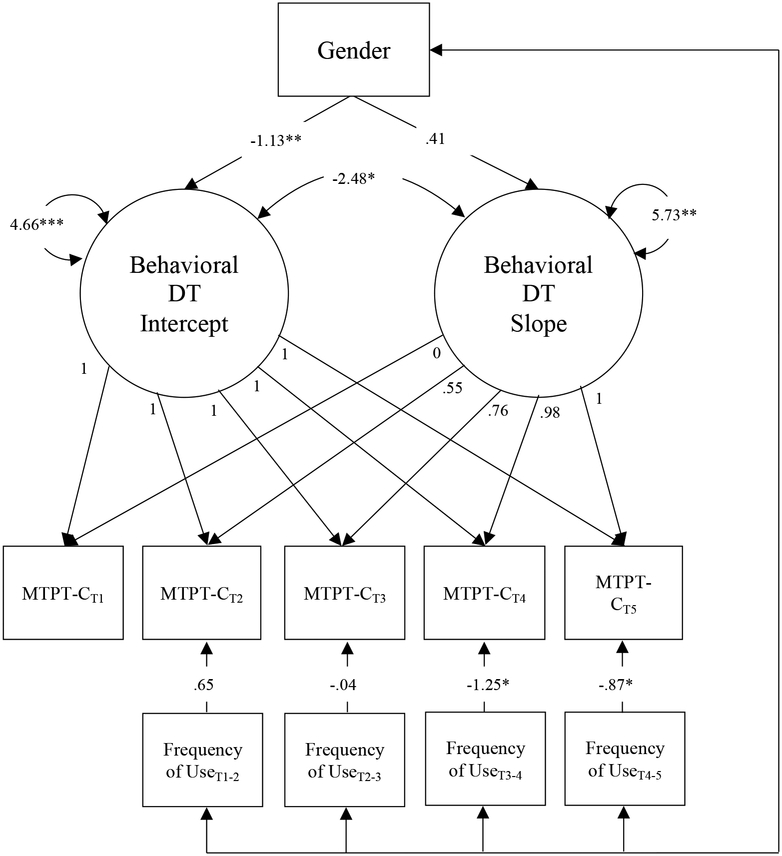
Figure 2.
Path diagram depicting the conditional latent growth model testing the influence of time-specific frequency of use on the behavioral DT trajectory including gender as a covariate.
Note: MTPT-C = Mirror Tracing Persistence Task – Computerized Version; T1 = pre-treatment assessment; T2 = residential discharge assessment; T3 = 3-month follow-up assessment; T4 = 6-month follow-up assessment; T5 = 12-month follow-up assessment; p < .05 = *, p < .01 = **, p < .001 = ***

