
Figure 1.
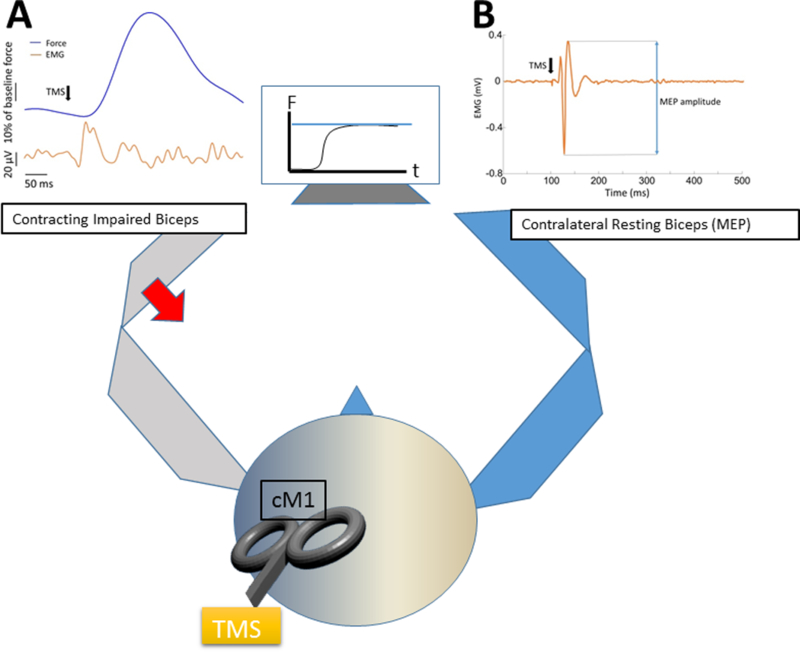
A) A representative trial of MEP response during 10% of the MVC task from a stroke subject and B) Representative TMS-induced force increment from a stroke subjects during 10% of the MVC task. The blue trace was the force, and the orange trace was the EMG signals. The EMG signals were rectified and low pass-filtered at 50Hz in order to get smoothed EMG signals. Six trials of the raw force signals and modified EMG signals during 10% of the MVC task were averaged for the subject in order to represent the averaged results for the task. Note: the averaged force signals were normalized by the background force (mean force over a 100-ms window prior to the TMS delivery) in this figure.