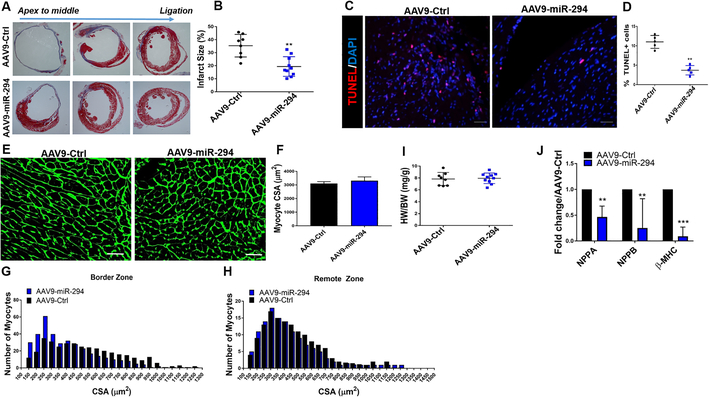
Figure 6: Infarct size, apoptosis and myocyte size analysis.
A) Reduced infarct size in AAV9-miR-294 (n=10) administered animals 8 weeks after MI compared to control animals (n=8) as measured by masson’s trichrome staining. Quantification of infarct size in (B). Decreased TUNEL+ cells in the heart treated with AAV9-miR-294 2days after MI compared to AAV9-Ctrl. TUNEL (red), nuclei (blue), scale bar = 40μm. Corresponding quantification in D. E-F) Analysis of myocyte cross-sectional area indicates no significant difference between AAV9-miR-294 (n=10) and AAV9-Ctrl (n=8) animals as determined by wheat germ agglutinin (WGA) staining (green). Scale bar = 40μm. G-H) Size distribution analysis indicated higher number of small sized myocytes in Border zone and remote area of AAV9-miR-294 (n=10) hearts compared to control (n=8) 8 weeks after myocardial infarction. I) HW/BW ratio was not significantly increased in AAV9-miR-294 (n=10) hearts compared to control (n=8) at 8 weeks. J) mRNA expression for markers of hypertrophy was significantly downregulated in AAV9-miR-294 treated (n=3) hearts compared to control (n=3). AAV9-Ctrl vs. AAV9-miR-294 *p < 0.05, **p < 0.01, ***p < 0.001, data was assessed using unpaired student’s t test.

