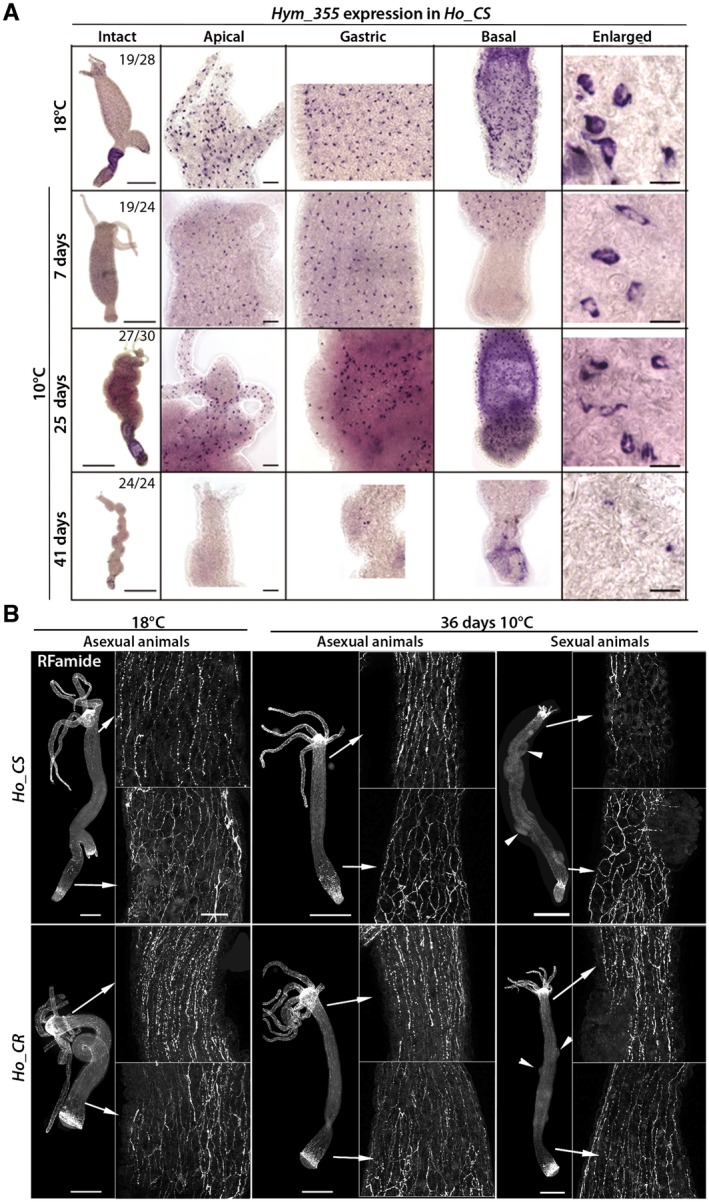
Figure 4.

Loss of neuronal density in Ho_CS animals undergoing aging. (A) Hym‐355 expressing nerve cells detected by in situ hybridization along the body column of Ho_CS animals maintained at 18°C or 10°C for 7, 25, or 41 days. Scale bars: 500 µm (intact), 50 µm (apical, gastric, and basal), 10 µm (enlarged). (B) RFamide expressing nerve cells immunodetected in Ho_CS and Ho_CR animals maintained at 18°C or 10°C for 36 days. Arrowheads indicate mature or post‐mature testes. Scale bars: 100 µm. [Colour figure can be viewed at wileyonlinelibrary.com]
