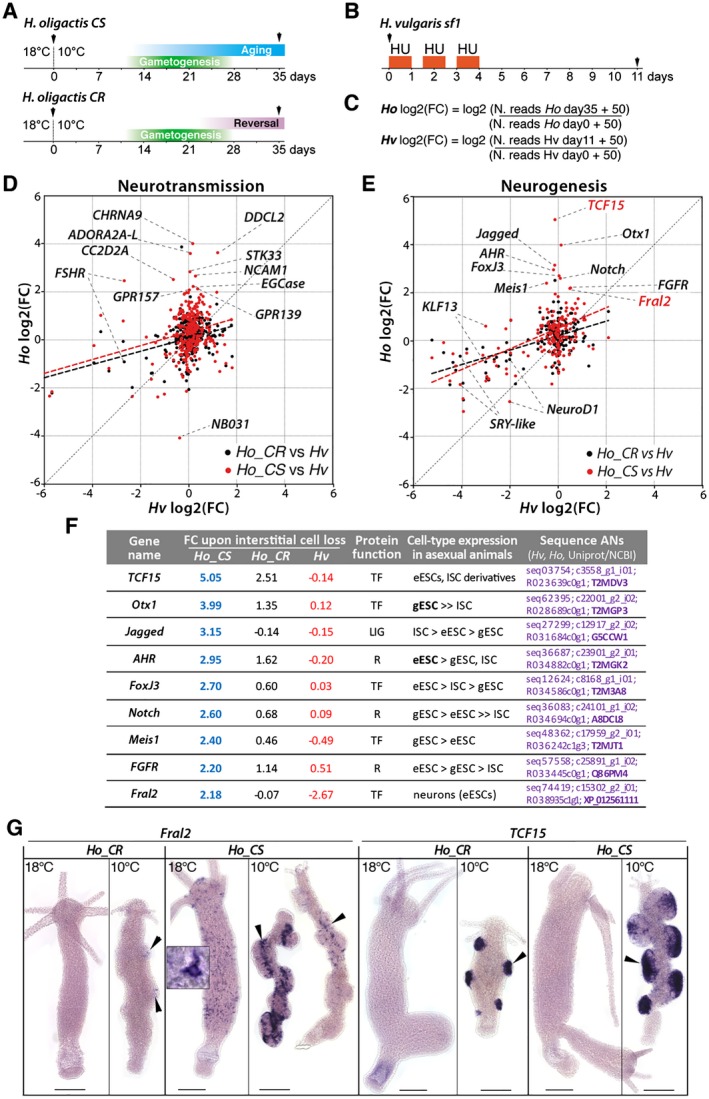
Figure 7.

Comparative analysis of gene modulations of neurotransmission and neurogenesis genes in nerve free H. vulgaris, Ho_CS, and Ho_CR. (A, B) Schemes representing the experimental conditions to produce qRNA‐seq data (black arrowheads) from Ho_CS and Ho_CR animals maintained at 10°C for 35 days, or from Hv_sf1 animals exposed to hydroxyurea (HU). (C) Equations used to calculate the log2 fold change (FC) for Ho_CS, Ho_CR animals between day‐0 and day‐35 of cold exposure, and Hv_sf1 animals between day‐0 and day‐11 after HU exposure. (D, E) Scatterplot of FC values from Hv_sf1 (x axis) and Ho_CS or Ho_CR (y axis). The thick dashed lines represent linear regression for the Ho_CS (red) and Ho_CR (black) conditions. (F) Modulations in the expression of nine neurogenic candidate genes in Ho_CS and Ho_CR animals maintained at 10°C for 35 days (blue and black numbers, respectively) and in HU‐treated H. vulgaris (red numbers) as identified in (E). Fold change values (FC) measured in Ho_CS and Ho_CR animals maintained at 10°C for 35 days or in HU‐treated Hv_sf1 animals were normalized over the values measured in Ho animals maintained at 18°C or in untreated Hv animals, respectively. LIG: ligand; R: receptor, TF: transcription factor. Detailed expression profiles are shown in Supplementary Figure S1. (G) Expression patterns of Fral2 and TCF15 in Ho_CS and Ho_CR animals maintained at 18°C or at 10°C for 35 days. Scale bar: 200 µm. [Colour figure can be viewed at wileyonlinelibrary.com]
