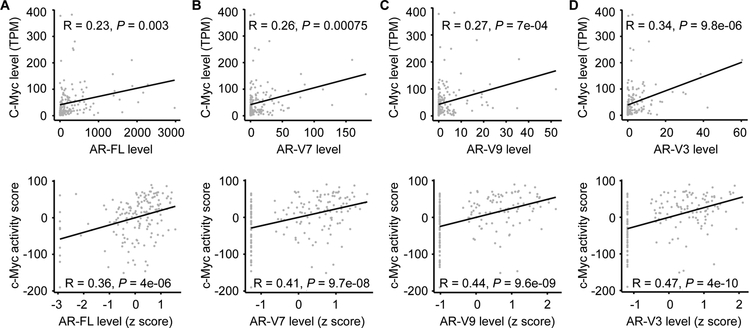
Figure 2. c-Myc level and activity positively correlate with AR-FL and AR-V levels in metastatic CRPC samples.
Pearson’s correlation coefficient analysis showing that c-Myc level (top panels) and activity (bottom panels) positively correlate with the levels of AR-FL (A), -V7 (B), -V9 (C), and -V3 (D) in 159 metastatic CRPC samples. The AR-FL, -V7, -V9, and -V3 levels were quantified as normalized number of RNA-seq reads spanning AR exons 7–8, 3-CE3, 3-CE5, and 2-CE4 splice junctions, respectively. The c-Myc activity score was computed as the sum of z-scores for the Schuhmacher c-Myc-target signature. TPM, transcripts per million.

