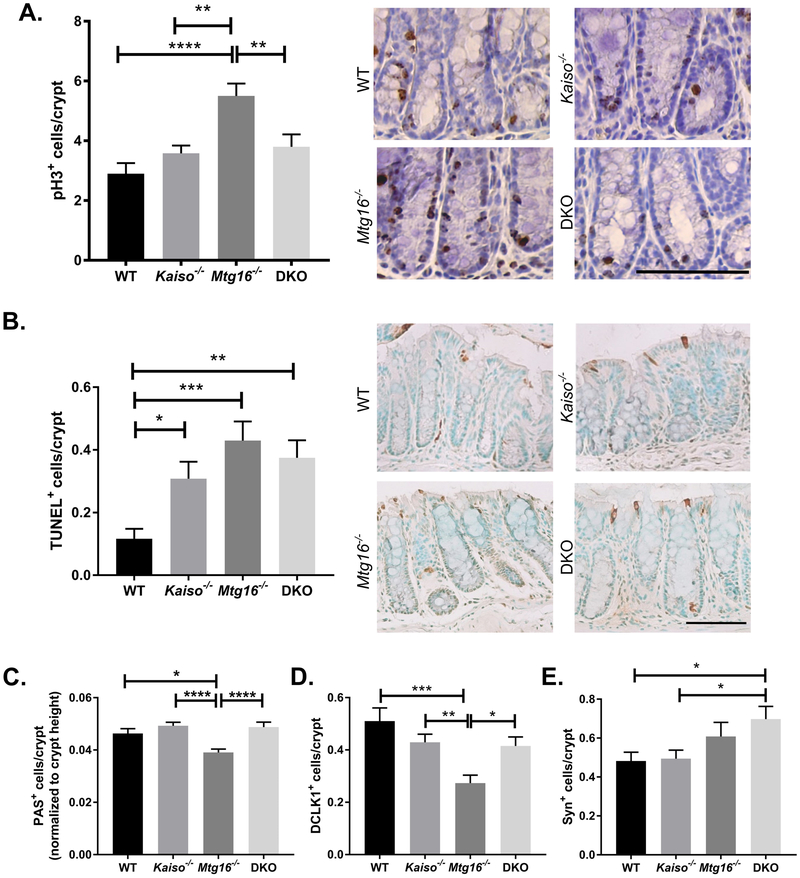
Figure 3.
Kaiso knockout rescues MTG16-dependent changes in adjacent normal tissue. A, Proliferation was determined in non-tumor tissue at the conclusion of the AOM/DSS protocol by phospho histone-H3 (pH3) immunohistochemistry. Quantification of pH3+ cells/crypt (left) and representative images of each genotype (right). B, TUNEL staining was performed to identify apoptotic cells. TUNEL+ cells/crypt (left) and representative images of each genotype (right). C, Goblet cells were identified by Periodic Acid Schiff (PAS) staining. Crypt height (in pixels) was calculated in Image J software and number of PAS+ cells was normalized to crypt height. D, Tuft cells were identified by DCLK1 staining and quantified as the number of DCLK1+ cells per crypt. E, Enteroendocrine cells were labeled with antibodies against synaptophysin (Syn). Quantification represented as Syn+ cells per crypt. Scale bar = 100μm. n≥10 crypts per mouse, 5 mice per genotype per analysis. *P<0.05, **P<0.01, ***P<0.001, ****P<0.0001; one-way ANOVA with Tukey’s correction.

