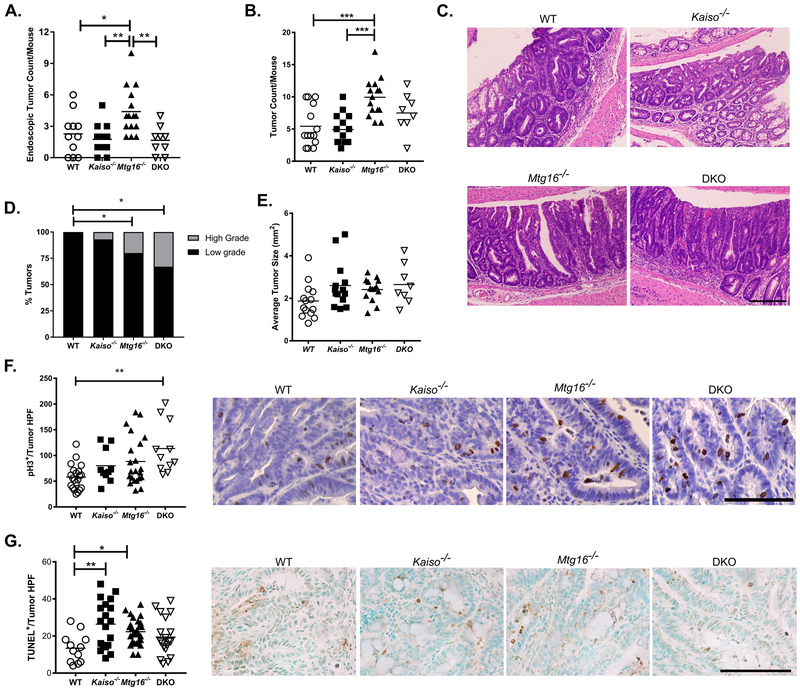
Figure 4.
Concurrent Kaiso loss modifies Mtg16−/− tumor number. A, Tumor number quantified from endoscopy videos at day 29 of the AOM/DSS protocol. B, Number of tumors quantified grossly at sacrifice. C, Representative tumor hematoxylin & eosin images from WT, Mtg16−/−, Kaiso−/−, and DKO mice (20x magnification). Scale bar = 200μm. D, Percentage of mice with high- and low-grade dysplasia as assessed by experienced pathologist. E, Size measurements of WT, Kaiso−/−, Mtg16−/−, or DKO tumors. F, Proliferation was determined by phospho histone-H3 (pH3) immunohistochemistry. Quantification of pH3+ cells/tumor high-powered field (HPF, 40x; left) and representative images of each genotype (right). Scale bar = 100μm. G, TUNEL staining was performed to identify apoptotic cells. TUNEL+ cells/tumor high-powered field (HPF; left) and representative images of each genotype (right). Scale bar = 100μm. n≥10 tumors per genotype per analysis. *P<0.05, **P<0.01, ***P<0.001; one-way ANOVA with Tukey’s correction (A, B, E, F, & G) or Fisher’s exact test (D).

