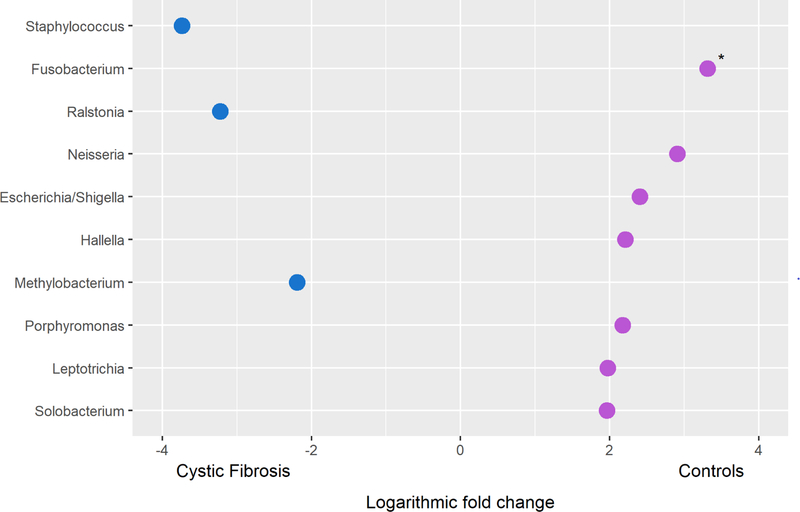
Figure 4: The differential abundance of individual genera in the lower airways of infants with cystic fibrosis compared to control infants.
The logarithmic (log2) fold change of the top 10 ranked genera in a linear model fit assessing between-group differences of bronchoalveolar lavage samples is presented. Genera with increased relative abundance in infants with cystic fibrosis and controls are indicated in blue (●) and purple (●) respectively. * p < 0.05.

