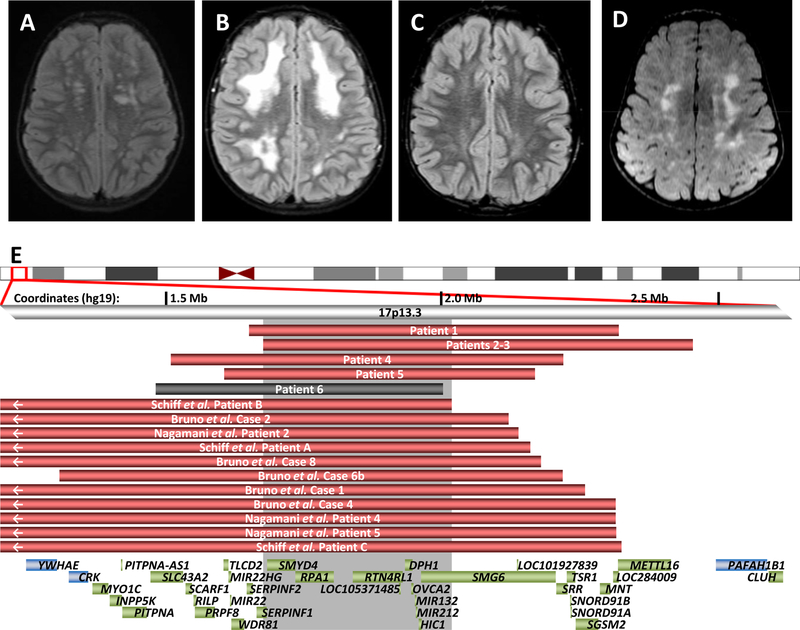
Figure 1. Leukoencephalopathies in individuals with 17p13.3 deletions.
Axial T2 weighted FLAIR (fluid attenuated inversion recovery) images demonstrate bilateral T2 hyperintensities in Subject 1 (A), Subject 2 (B), Subject 3 (C) and Subject 5 (D). (E) Deletions associated with abnormal MRIs in our cohort and review of the literature are red; the individual with a normal MRI is shown in gray. Gray shaded area represents the smallest region of overlap among cases with characteristic leukoencephalopathy. Genes in the region are shown as green boxes, with the critical genes of note flanking the region shown in blue.

