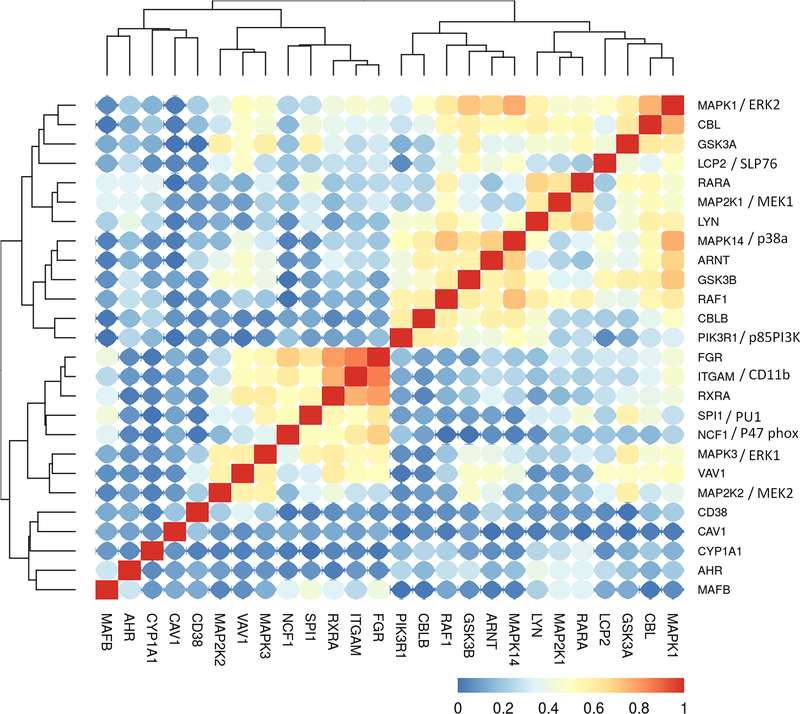
Figure 3:
Clustering analysis of the TARGET non-APL AML (BCCA cohort) RNA-Seq data set, using the gene expression data for the genes we analyzed in HL-60 model. The Pearson correlation between each gene pairs were calculated and then a hieratical clustering was performed on the absolute correlation. Red color represents higher correlation (either positive or negative) and blue color represents less correlation. 264 patient samples were included in the analysis.

