
Figure 3.
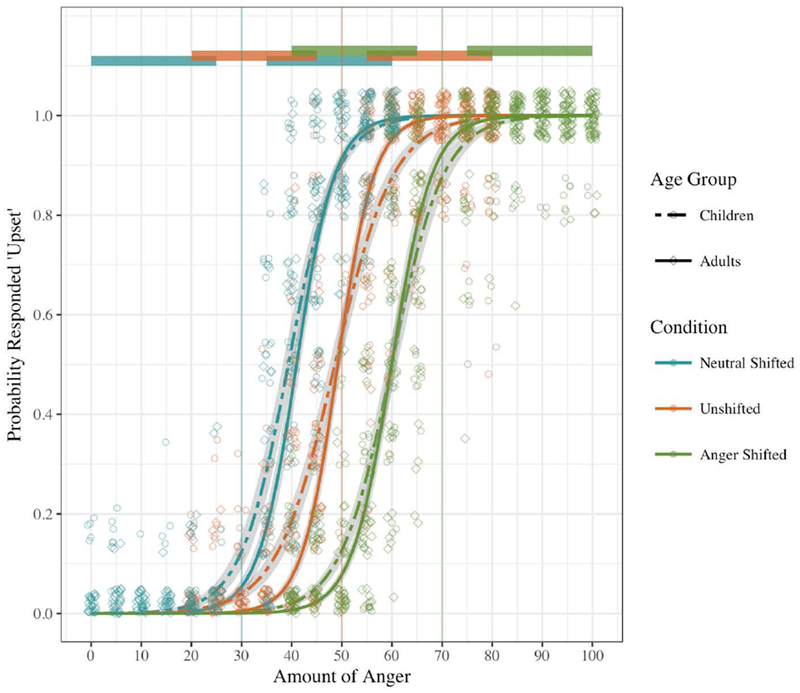
Experiment 1 testing phase: Model predictions and participant-level data. Note. Lines are point estimates from logistic mixed-effects models with the three-way interaction between Age Group, Condition (dummy-coded for the sake of graphing), and Percent Anger, and all lower-order effects. Error bands represent standard errors of the point estimates. Points are individual participants’ proportion of “upset” responses at a given morph value. Vertical lines indicate the implied category boundary for each condition. Horizontal bars at the top indicate the range of morphed images to which participants in each of the three conditions were exposed.