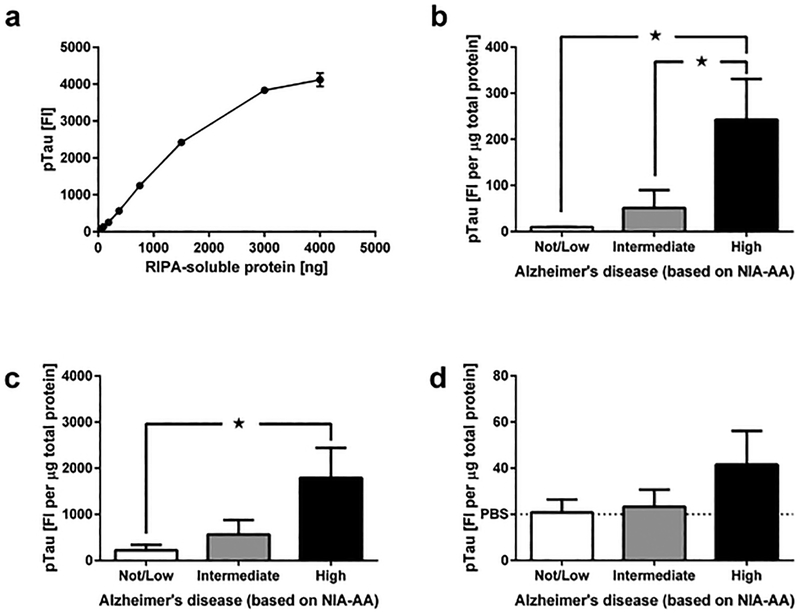
Figure 3.
Determination of optimal FFPE sample amounts for Luminex analysis of pTau, and quantification of pTau in FFPE tissue from cases with Not/Low, Intermediate and High NIA-AA AD severity. (a) Fluorescent-intensity signals for pTau as function of increasing amounts of RIPA-soluble extracts from middle frontal gyrus. (b) pTau levels in MFG samples from cases with varying NIA-AA AD severity (Not/Low: n = 10, Intermediate: n = 10, High: n = 9). (c) pTau levels in hippocampal samples from cases with varying NIA-AA AD severity (Not/Low: n = 10, Intermediate: n = 10, High: n = 9). (d) pTau levels in neostriatal samples from cases with varying NIA-AA AD severity (Not/Low: n = 10, Intermediate: n = 10, High: n = 9). pTau levels in panels (b-d) are normalized to the amount of RIPA-soluble protein (fluorescent intensity per μg). All data are presented as mean ± SEM. ★ p < 0.05 and ★★ p < 0.01.

