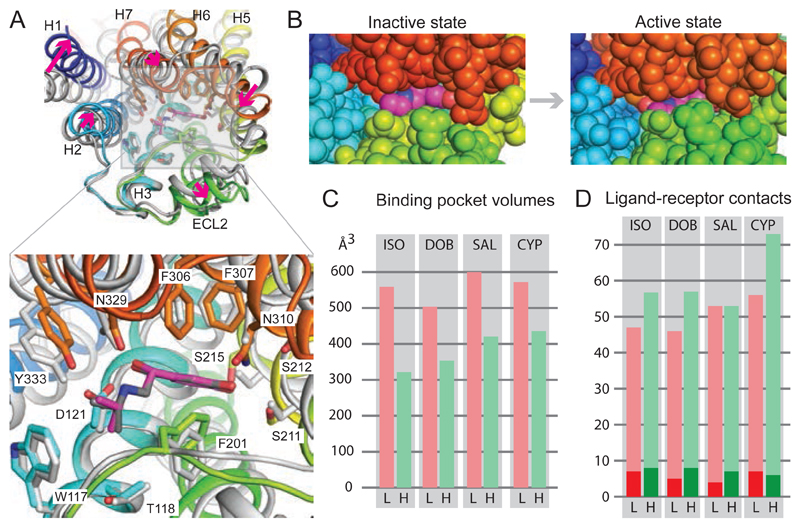
Fig. 2. Conformational changes in isoprenaline-bound β1AR.
(A), Superposition of isoprenaline-bound β1AR in the inactive state (grey, PDB ID 2Y03) with isoprenaline-bound β1AR in the active state (rainbow colouration). Arrows (magenta) indicate the transitions from the inactive to active state. Alignment was performed based on the isoprenaline molecules using PyMol (magenta, isoprenaline bound to active state β1AR). (B) View of the orthosteric binding site from the extracellular surface with atoms shown as space filling models: isoprenaline (magenta, carbon atoms); β1AR: H1, dark blue; H2, light blue; H5, yellow; ECL2, green; ECL3 and parts of H6 and H7, red. (C) Volumes of the orthosteric binding site in the low-affinity inactive state (L, pink bars) compared to the high-affinity active state (H, green bars). (D) Number of atomic contacts (Database S1) between the respective ligands and β1AR in the low-affinity inactive state (L, pink bars) compared to the high-affinity active state (H, green bars). The dark shades represent the number of polar interactions. Ligand abbreviations are shown in Fig. 1.

