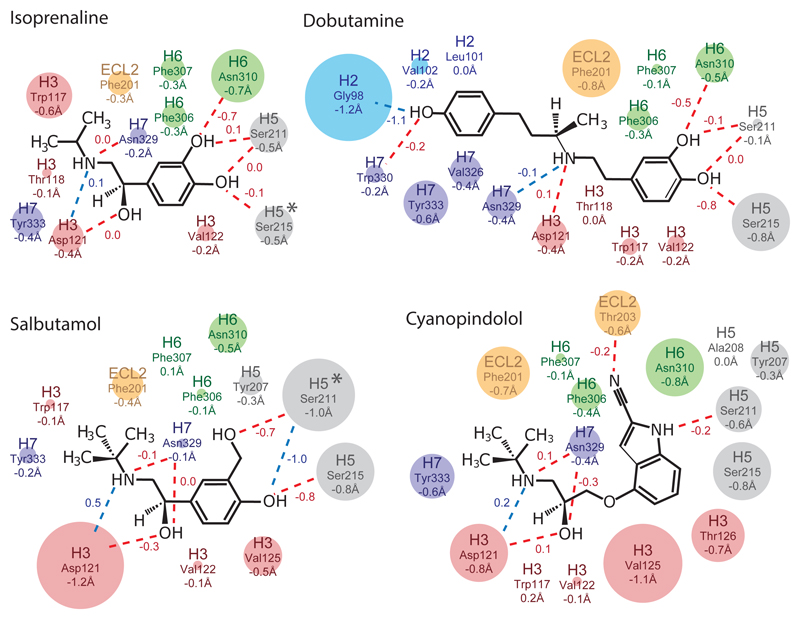
Fig. 3. Changes in β1AR-ligand contact distances.
The maximal changes in contact distances between ligands and atoms in β1AR from the inactive to active states are depicted. Amino acid side chains making contact to the ligands are indicated and coloured according to where they are in β1AR (blue, H2; red, H3; orange, ECL2; grey, H5; green, H6; purple, H7) with the diameter of the circle representing the magnitude of the distance change (shown as numbers below the amino acid residue). Numbers next to the lines indicate the change in length of polar contacts (blue dashed lines) and hydrogen bonds (red dashed lines; determined using HBPLUS). Negative numbers imply a decrease in distance between the ligand and receptor in the transition from the inactive state to the active state. An asterisk indicates a significant rotamer change between the inactive and active states. For the details of additional contacts made by each side chain, see Fig. S2.

