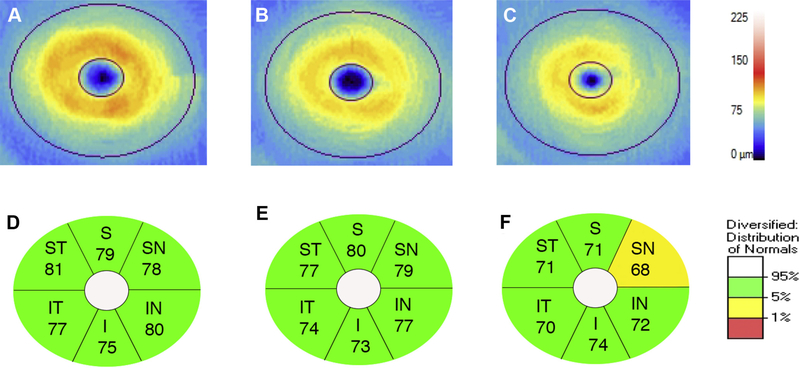
Figure 4.
Ganglion cell analysis (Carl Zeiss Meditec, Dublin, CA) of representative optical coherence tomography images of the macula of the left eye in a control subject (A), MCI subject (B), and AD subject (C). Corresponding GC-IPL thickness for each elliptical annular region shows diffuse thinning in the AD subject (F) compared to the control (D) and MCI subjects (E). S, superior; ST, supero-temporal; SN, supero-nasal; I, inferior; IT, infero-temporal; IN, inferonasal.

