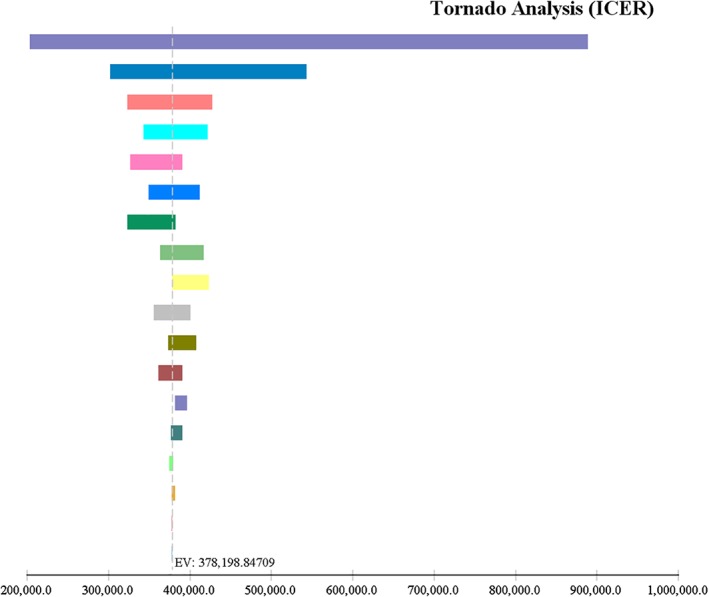
Figure 2.

One‐way sensitivity analysis showing all parameters contributing to hepatitis C virus treatment cost. ( ), Weekly cost of direct‐acting antiviral (DAA) (3847.0–11 628.0); (
 ), probability of sustained virological response (SVR) with pegylated interferon and ribavirin (PR) at week 24 (0.67–0.84); (
 ), utility of chronic hepatitis C infection (0.84–1.0); (
 ), weekly cost of outpatient visits while on PR (6.9–345.0); (
 ), disutility associated with using PR (0.091–0.121); (
 ), weekly cost of hospitalization while on PR (0.0–281.4); (
 ), disutility of treatment failure (0.06–0.16); (
 ), utility of SVR (0.92–1.0); (
 ), weekly cost of Pegylated interferon + ribavirin (429.5–642.8); (
 ), probability of SVR with DAA at week 12 (0.93–0.98); (
 ), weekly cost of hospitalization while on DAA (0.0–396.5); (
 ), weekly cost of emergency department (ED) visit while on DAA (0.0–243.2); (
 ), weekly cost of outpatient visits while on DAA (61.2–299.2); (
 ), weekly cost of erythropoietin while on PR (0.0–21.3); (
 ), weekly cost of filgrastim while on PR (0.0–19.6); (
 ), probability of SVR with DAA at week 36 (0.84–0.91); (
 ), weekly cost of ED visit while on PR (0.0–55.0); (
 ), probability of SVR with DAA at week 24 (0.95–0.96).
