Fig. 1.
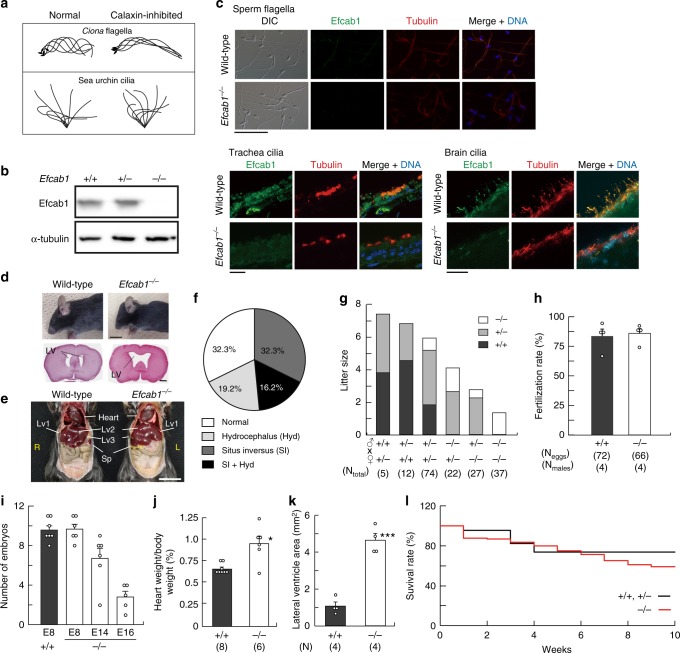
Generation and phenotypes of Efcab1 mutant mice. a Function of calaxin in the propagation of flagellar and ciliary waveforms. Typical waveforms of Ciona sperm flagella and sea urchin embryonic cilia in normal and calaxin-inhibited conditions are shown. Modified from previous publications30,32. b Immunoblot analysis of Efcab1−/− sperm by anti-Efcab1 and anti-acetylated-α-tubulin antibodies. c Immunofluorescence analysis of Efcab1−/− sperm flagella, trachea and ependymal cilia by anti-Efcab1 and anti-acetylated-α-tubulin antibodies. Scale bar, 50 μm (top) and 25 μm (bottom left and right). d Efcab1−/− mouse showing hydrocephalus (upper; head morphology, scale bar = 1 cm, lower; 5 µm paraffin section stained with hematoxylin-eosin) and e situs inversus. LV, lateral ventricle; Lv, liver; Sp, spleen. f Percentage of Efcab1−/− mice with hydrocephalus and/or situs inversus. N = 130 (71; male, 59; female). g Average litter size from parents of different genotypes. h The rate of in vitro fertilization of eggs with epididymal sperm collected from Efcab1+/+ and Efcab1−/− mice. Numbers in parentheses indicate the number of eggs examined from triplicate experiments. i Number of embryos at E8, E14 and E16 after mating with Efcab1+/+ or Efcab1−/− male mice. j The ratio between heart and body weight in Efcab1+/+ and Efcab1−/− mice. k Comparison of lateral ventricle area between Efcab1+/+ and Efcab1−/− mice. l Survival rate at 10 weeks. N = 46 (Efcab1+/+ and Efcab1+/−) and N = 198 (Efcab1−/−). Values indicate mean ± SEM. *p < 0.05, ***p < 0.001 vs. Efcab1+/+ (Student’s t-test)

