Fig. 3.
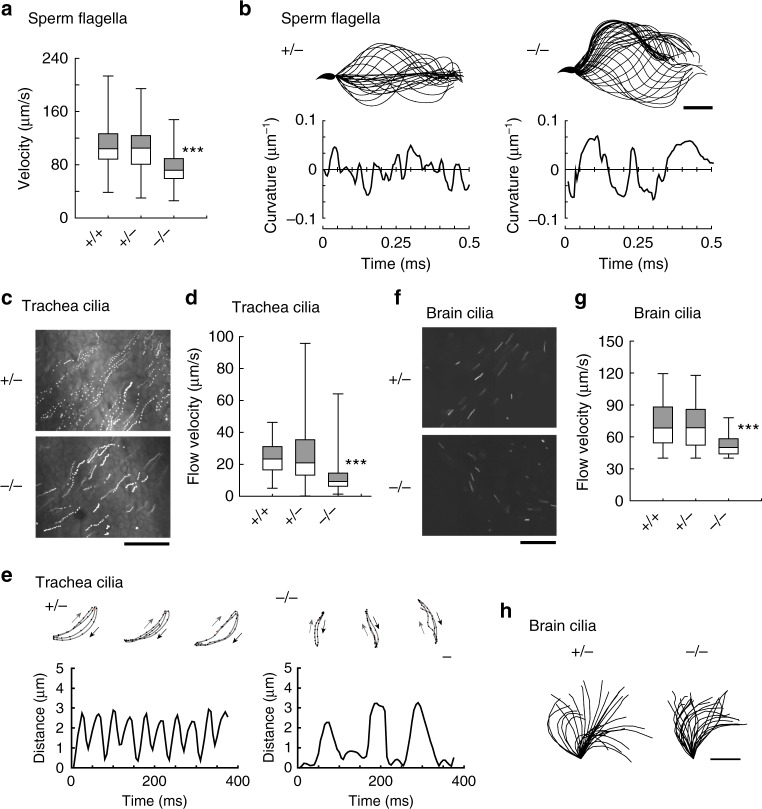
Motility of sperm flagella and epithelial cilia in Efcab1−/− mice. a Average sperm curvilinear velocity. b Flagellar bending patterns (upper) and curvatures (lower) of sperm in Efcab1+/− and Efcab1−/− mice. Images at 2 ms intervals are overwritten (25 or 43 images for Efcab1+/− and Efcab1−/− sperm, respectively). Flagellar curvatures at 50 μm from the base are plotted against time. c Trajectories of fluorescent beads in trachea of Efcab1+/− and Efcab1−/− mice. Fifteen images acquired at 0.2 s intervals are superimposed. d Flow velocity of fluorescent beads in trachea cilia. e Movement of trachea cilia in Efcab1+/− and Efcab1−/− mice. Trajectories of fluorescent beads bound to ciliary tips (upper) are shown with effective (black) and recovery (gray) stroke paths, with changes in distance of bound fluorescent bead (lower). f Movement of ependymal cilia. Trajectories of fluorescent beads are shown. Fifty images acquired at 5 ms intervals are superimposed. g Flow velocity of fluorescent beads in ependymal cilia. h Ciliary bending patterns in Efcab1+/− and Efcab1−/− mice. Images at 2 ms intervals are overwritten (30 images for Efcab1+/− and 25 images for Efcab1−/− nodal cilia). Scale bar: 20 µm (b), 50 µm (c), 50 µm (c, f), 10 µm (h). Boxes correspond to the first and third quartiles, and whiskers extend to the full range of the data. ***p < 0.001 vs. Efcab1+/+ (Student’s t-test)

