Fig. 4.
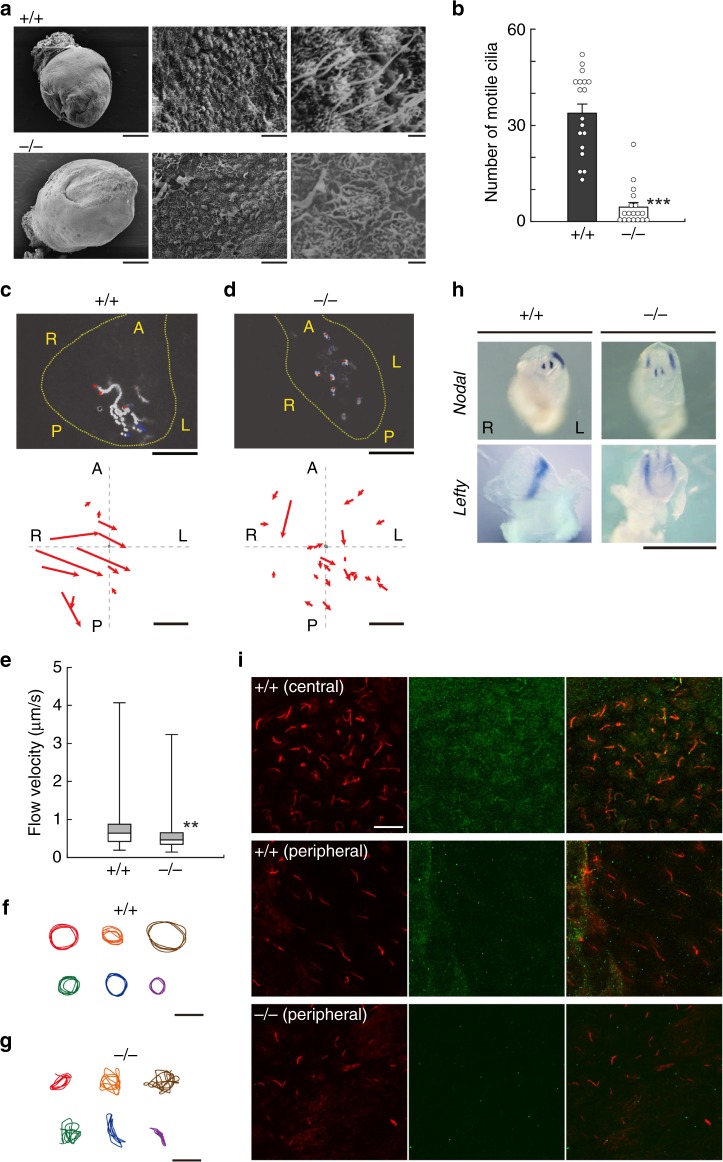
Appearance and motility of nodal cilia in Efcab1−/− mice. a Scanning electron microscopy of E7.5 embryo and nodal cilia in Efcab1+/+ and Efcab1−/− mice. Left, whole embryo; middle, node area; right, magnified image of nodal cilia. b Number of motile cilia in the node. N (embryos) = 18 (Efcab1+/+) and N = 18 (Efcab1−/−). c, d Nodal flow in Efcab1+/+ (c) or Efcab1−/− (d) E7.5 embryos. Upper; Trajectories of fluorescent beads driven by nodal flow. Sixty images acquired at 0.25 s intervals are superimposed. Red and blue dots indicate the start and end points of the superimposition, respectively. Lower; direction and distance traveled by fluorescent beads in Efcab1+/+ or Efcab1−/− nodal flows. Arrow length represents bead path and distance for 5 s. A, anterior; P, posterior; R, right; L, left. e Flow velocity of fluorescent beads. Boxes correspond to the first and third quartiles, and whiskers extend to the full range of the data. N (beads) = 112 from four embryos (Efcab1+/+) and N = 46 from 10 embryos (Efcab1−/−). f, g Trajectories of fluorescent beads binding to the tip of nodal cilia in Efcab1+/+ (f) and Efcab1−/− (g) mice. h Whole-mount in situ hybridization analysis of Nodal and Lefty expression in E8.0 embryos. R, right; L, left. Scale bars: 200 µm (a, left), 10 µm (a, middle, c, d), 1 µm (a, right), 4 µm (f, g), 1 mm (h). i Immunofluorescent localization of Efcab1 in the central and peripheral regions of node in Efcab1+/+ and Efcab1−/− mice. Images with anti-Efcab1 (green) and anti-acetylated-α-tubulin (red) antibodies are shown. Scale bars: 10 µm. **p < 0.01, ***p < 0.001 vs. Efcab1+/+ (Student’s t-test)

