Figure 5.
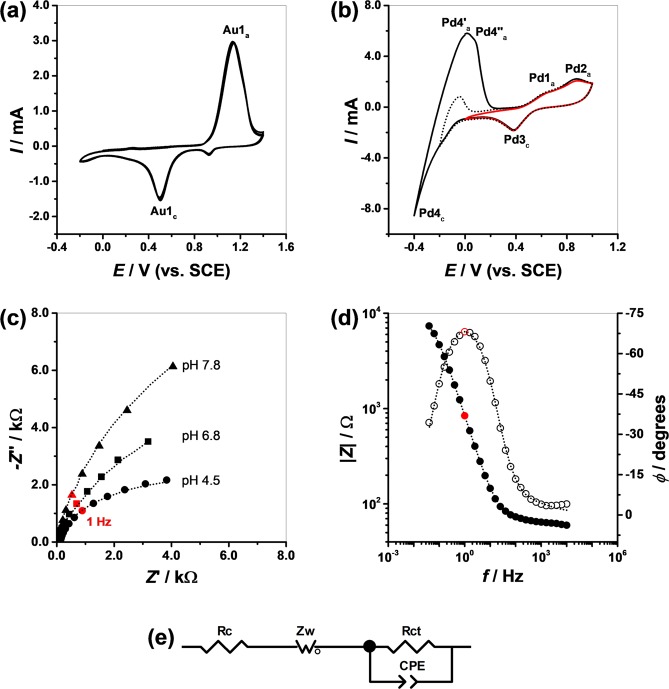
(a,b) Cyclic voltammograms in 0.1 M H2SO4 at v = 100 mV s−1 of: (a) Au/PMMA/PET and (b) PdO/Pd/Au/PMMA/PET. (c,d) EIS spectra of Pd-PdO/Au/PMMA/PET: (c) Nyquist diagram representing the imaginary component –Z” vs. the real component Z’ of the total impedance Z recorded in electrolytes with different pH values. (d) Bode diagram representing |Z| and phase angle φ vs. frequency f recorded in pH 4.5. (e) Schematic representation of the circuit used to fit the experimental EIS data points. The dotted curves represent the fitting results of the experimental data points with the equivalent circuit.

