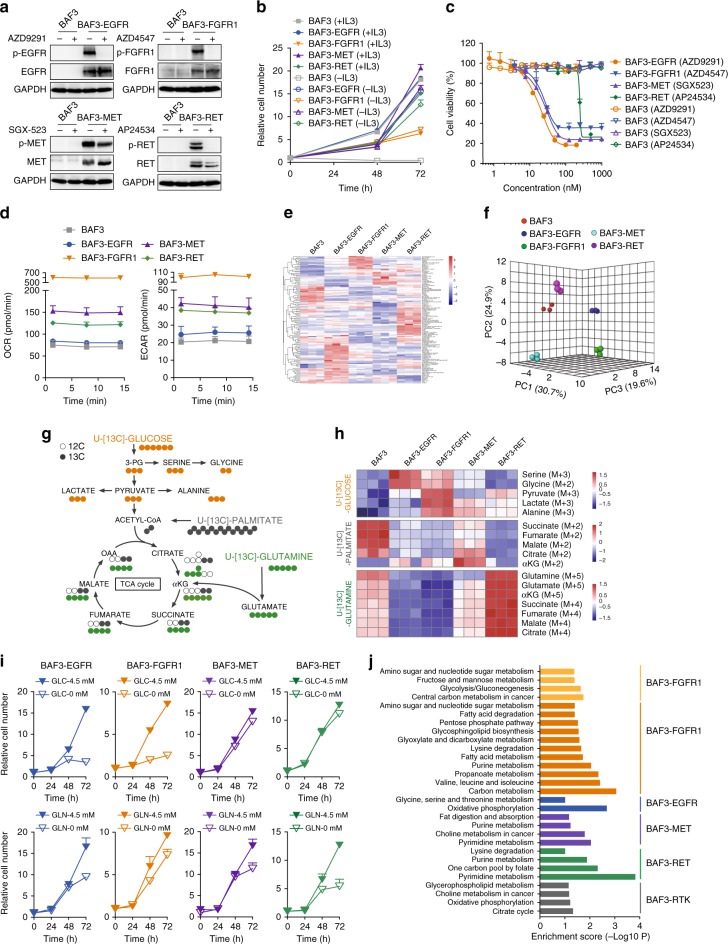
Fig. 1.
Oncogenic RTK differentially reprogram metabolic phenotypes. a Immunoblotting analysis. Cells were treated with indicated RTK inhibitors (100 nM) for 1 h. b IL3 dependence analysis. Cell growth fold changes with or without IL3 were plotted by counting cell numbers. Data were means of triplicates; error bars represented SD. c Cell sensitivity to RTK inhibition. Cells were treated with indicated RTK inhibitors for 72 h and cell viability was analyzed using CCK8 assay. Data were means of duplicates; error bars represented SD. d Oxygen consumption rate (OCR) and extracellular acidification rate (ECAR) measurement using Seahorse XF96 analyzer. Data were means of triplicates; error bars represented SD. e Heatmap depicting the metabolite intensities in the metabolomics data. Rows indicate different metabolites, and columns indicate different cells (n = 3 per cell line). The log transformed metabolite intensities are Z scored/standardized. f Principal component analysis (PCA). Three-dimensional clustergram depicts the internal structure of metabolomics data set with respect to variance by MetaboAnalyst 4.0. g Tracer scheme illustrating the flux of [U-13C6]-glucose (orange), [U-13C5]-glutamine (green) or [U-13C16]-palmitate (gray). Cells were cultured in the presence of [U-13C6]-glucose (12 h), [U-13C5]-glutamine (24 h) or [U-13C16]-palmitate (24 h) prior to mass spectrometry analysis. h Heatmap depicting representative 13C-labeled fraction contribution of the metabolite isotopologues. Rows indicate different metabolites and columns indicate different cells (n = 3 per cell line). The log transformed metabolite intensities are Z scored/standardized. i Glucose/glutamine dependence analysis. Cells were cultured in RPMI-1640 with or without glucose (GLC)/glutamine (GLN) for 3 days. Cell growth fold changes were plotted by counting cell numbers. Data were means of triplicates; error bars represented SD. j Transcriptome analysis. KEGG pathway enrichment analysis of differentially transcribed clusters in a heatmap of transcriptome profiling by RNA-seq. The different clusters are color-coded in Supplementary Fig. 1p. Bars show the enrichment score of pathways and are presented according to p value using Fisher's exact test (p < 0.05). See the complete list of KEGG pathways in Supplementary Dataset 6. Source data are provided as a Source Data file

