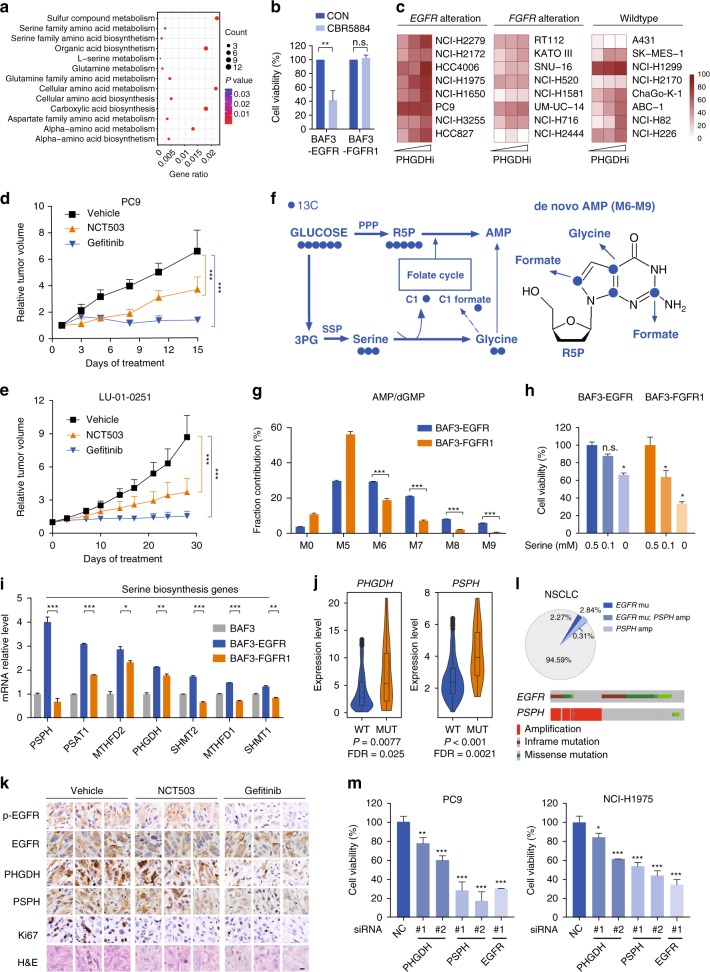
Fig. 2.
EGFR activation promotes the serine synthesis pathway. a GO enrichment analysis of upregulated metabolic genes in EGFR-mutant lung cancer patients. Data were from 740 lung adenocarcinoma datasets from TCGA database (cutoff fold change > 2 and p < 0.01 versus EGFR wildtype cancer). Gene ratio represents the proportion of counted genes in the enriched pathway. b Sensitivity to PHGDH inhibition. Cell viability was measured using CCK-8 assay after treatment with CBR5884 (20 µM) for 72 h. Data were means of triplicates; error bars represented SD. c Sensitivity of a panel of cancer cells to PHGDH inhibition. Cells with indicated genetic alterations were treated with CBR5884 at 6.25, 12.5 or 25 µM for 6 days. Heatmap depicts the inhibition rate of the cell growth. d, e Tumor growth curve of PC9 xenograft and LU-01-0251 PDX. Mice were dosed with NCT-503 (40 mg/kg) or Gefitinib (5 mg/kg for PC9, 1 mg/kg for LU-01-0251) daily for indicated days (n = 8 for PC9, n = 6 for LU-01-0251). Data were means and error bars represented SEM. f Tracer scheme illustrating the flux of [U-13C6]-glucose to purine nucleosides. g 13C enrichment of purine nucleosides after [U-13C6]-glucose labeling for 24 h. h Serine dependence analysis. Cell viability was measured by counting cell numbers after 3-day culture. i Transcript analysis in BAF3-RTK cells compared with BAF3 cells. j, PSPH or PHGDH expression between EGFR mutant and wildtype subtypes. Data source was as described in a. k Immunohistochemistry analysis of tumor tissues from LU-01-0251 PDX as described in e. Tumor samples were collected at 6 h after the last dosing. Scale bar, 20 μm. l Upper: The occurrence of EGFR activating mutation and/or PSPH amplification in TCGA data sets; Lower: The alteration of EGFR and PSPH gene in NSCLC patients. m Cell growth measurement. Cells numbers were counted after transfected with indicated siRNAs for 72 h. Data were means of triplicates; error bars represented SD. For all bar graphs, ***p < 0.001, **p < 0.01, *p < 0.05, n.s. ≥ 0.05 for two-tailed Student’s t test. Source data are provided as a Source Data file

