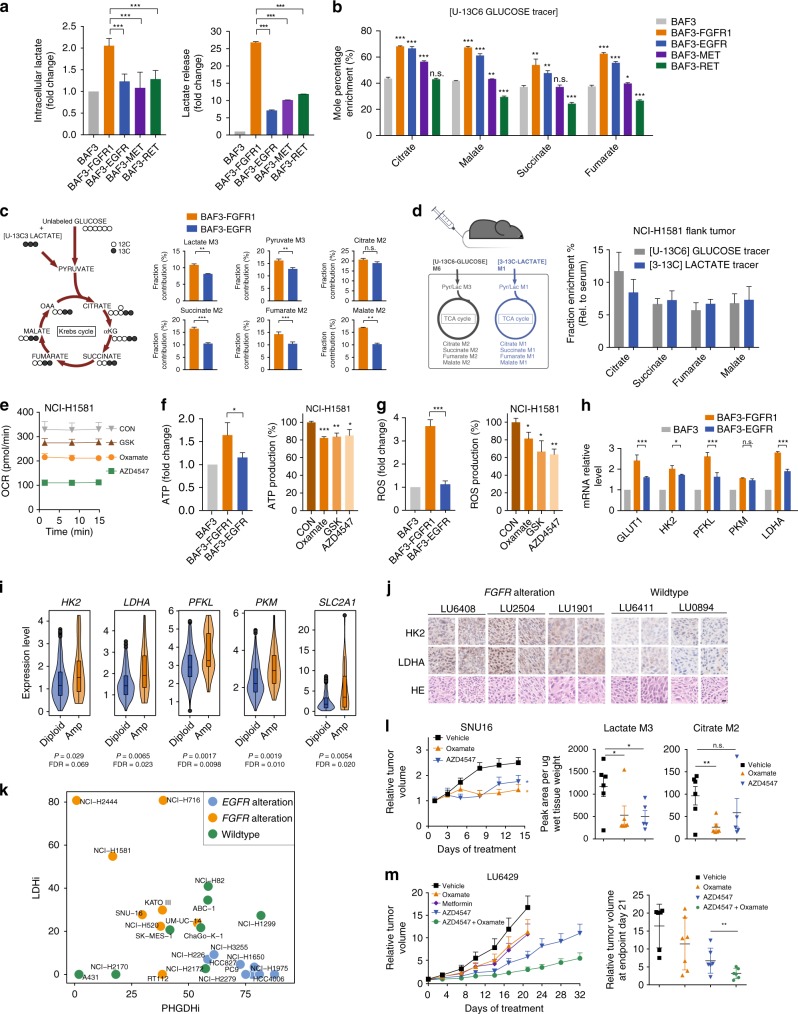
Fig. 3.
FGFR activation enhances aerobic glycolysis and recycles lactate. a Lactate production and lactate release. b Enrichment of 13C-labled intermediate metabolites. Cells were cultured in the presence of [U-13C6]-glucose for 24 h. c Competitive uptake of glucose and lactate. Cells were cultured with both [U-13C3]-lactate (5 mM) and label-free glucose (10 mM) for 24 h. Left, Tracing map of [U-13C3]-lactate. Right, Enrichment of 13C-labled intermediate metabolites. d The incorporation percentage of lactate to the TCA cycle in NCI-H1581 xenograft tumors (n = 6). Left, Scheme for co-infusions of [U-13C6]-glucose and [3-13C]-lactate and the tracing map. Right, Fraction enrichment of the intermediates. e OCR measurement. Cells were treated with AZD4547 (100 nM, 24 h), Oxamate (10 mM, 6 h) or GSK2837808A (20 μM, 6 h). f, g ATP production and ROS level. NCI-H1581 cells were treated as indicated in e. h Transcript analysis of BAF3-RTK cells normalized by that in BAF3 cells. i The comparison of glycolytic gene expression between FGFR amplified and diploid cancer. Data were from 740 lung adenocarcinoma patients in TCGA data sets. j Immunohistochemistry analysis of tumor tissues from NSCLC PDX tumors. Shown are the representative fields from one section per tumor tissue (2 independent tumor tissues per PDX model). Scale bar, 20μm. k Scatter plot showing the inhibition rate of PHGDH inhibitor (PHGDHi) CBR5884 (12.5 μM) and LDH inhibitor (LDHi) GSK2837808A (50 μM). Cells were treated for 6 days. l Left: tumor growth curve of SNU16 xenograft model. Right: glucose-derived metabolites in tumor tissue. See the dosing regimen in Methods. Data were means (n = 6) and error bars represented SEM. m Tumor growth curve of LU6429 PDX model and grouped scatter plot of individual mice relative tumor volume on Day 21. See the dosing regimen in Methods. Data in a, b, e-h were means of triplicates and error bars represented SD. Data in c, d, l, m were means and error bars represented SEM. For all bar graphs, ***p < 0.001, **p < 0.01, *p < 0.05, n.s. ≥ 0.05 for two-tailed Student’s t test. Source data are provided as a Source Data file

