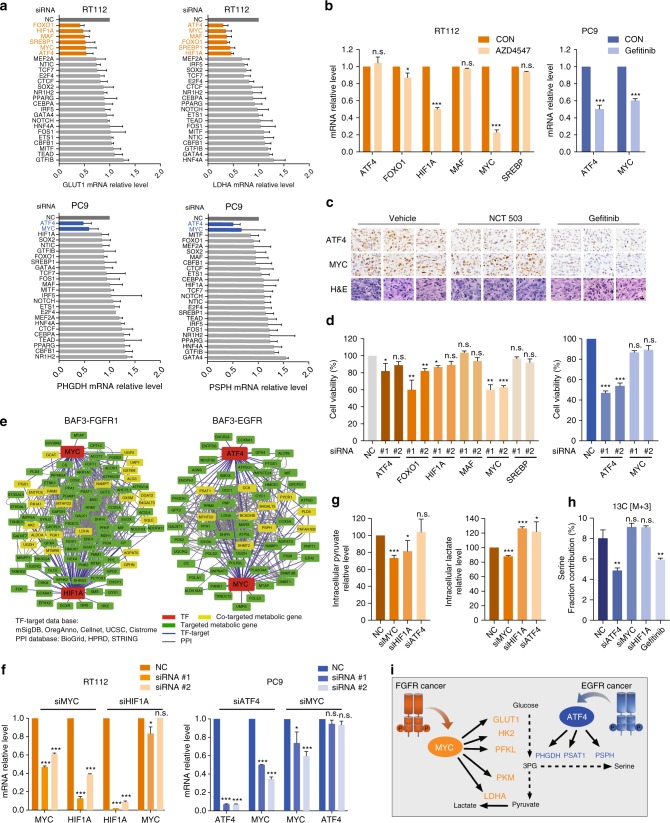
Fig. 4.
ATF4 and c-Myc orchestrate metabolic reprogramming. a Metabolic gene expression upon the depletion of candidate transcription factors (TFs). The Y-axis indicates the transcription factors and X-axis shows relative mRNA levels of metabolic genes. Gene expression was measured by RT-qPCR after transfected with indicated siRNA for 72 h. NC, negative control. Data were means of duplicates; error bars represented SD. b RT-qPCR transcript analysis. Cells were treated with AZD4547 (100 nM) or Gefitinib (100 nM) for 24 h and the mRNA level of indicated TFs was measured by RT-qPCR. The expression level of indicated genes was normalized by that of the untreated group (CON). Data were means of triplicates; error bars represented SD. c Immunohistochemistry analysis. PC9 xenograft models were treated with NCT-503 (40 mg/kg) or Gefitinib (5 mg/kg) daily for 15 days (n = 8). Tumor samples were collected at 6 h after last dosing. Scale bar, 20 μm. d Cell viability assay. Cells were transfected with two independent siRNAs targeting indicated TFs for 72 h and the cell viability was analyzed by counting cell numbers. Data were means of duplicates; error bars represented SD. e A network model describing the TF-targeted metabolic genes interactions. f RT-qPCR transcript analysis. Cells were transfected with indicated siRNA for 72 h and metabolic gene expression was measured by RT-qPCR. Data were means of triplicates; error bars represented SD. g Intracellular pyruvate and lactate levels. RT112 cells were transfected with indicated siRNA for 48 h and pyruvate and lactate aboundance was measured using GC/MS. h Analysis of [U-13C6]-glucose-derived serine. PC9 cells were transfected with indicated siRNA for 48 h followed by 24 h-culture in the presence of [U-13C6]-glucose. Serine isotopologue M3 was measured by GC-MS. Gefitinib treatment (100 nM, 24 h) was used as a positive control. Data in g, h were means of triplicates; error bars represented SEM. i Diagram depicting RTK-driven transcriptional reprogramming to orchestrate metabolic changes. For all bar graphs, ***p < 0.001, **p < 0.01, *p < 0.05, n.s. ≥ 0.05 for two-tailed Student’s t test. Source data are provided as a Source Data file

