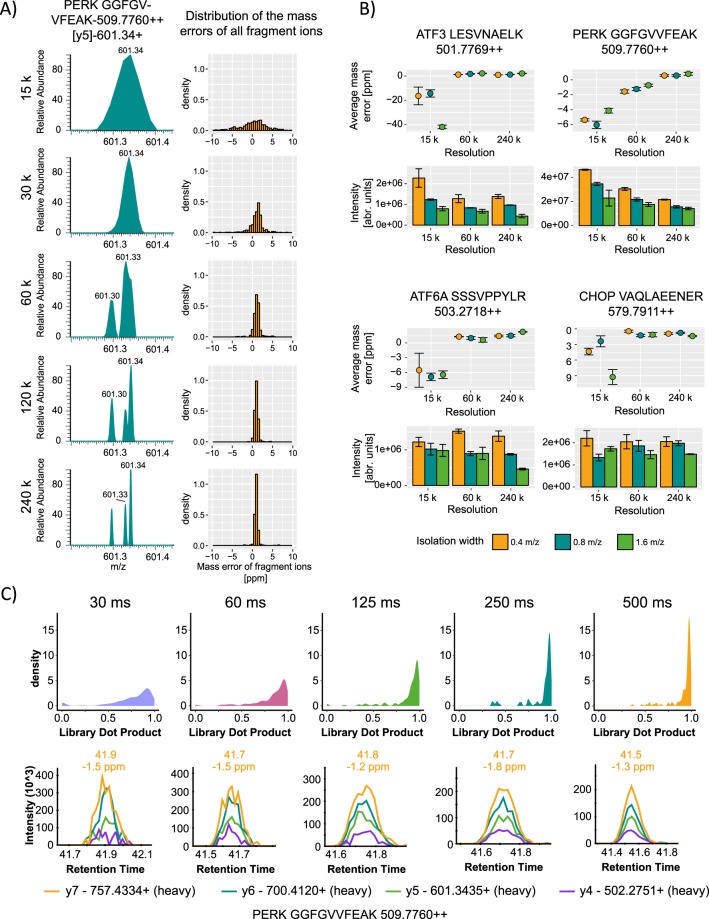
Figure 1.
Establishing a high resolution (HR) targeted proteomics approach for low abundancy proteins. (A) Effect of different resolution on the mass separation and mass deviation. Right panel displays the resolution effect on a representative example of the PERK peptide GGFGVVFEAK transition y5, left panel shows the distribution of the average mass deviation at different resolution for all analyzed precursors. (B) Effect of different isolation widths on the mass accuracy and intensity at three different resolutions 15 k, 60 k and 240 k: Isolation width was set to m/z values of 0.4, 0.8 and 1.6, injection time to 500 ms and an AGC target value of 3 × 10⁶ was used for all measurements respectively. (C) Global effect of the injection time on the dot product at high resolution (upper panel), below representative example of injection time effects on ion traces of the PERK peptide GGFGVVFEAK at high resolution (240 k). All measurements were repeated at least 3 times.

