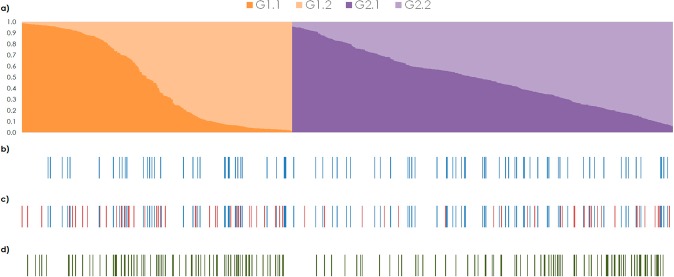
Figure 1.
Graphical display of the results of the STRUCTURE analysis. Each genotype is represented by a vertical bar partitioned into K = 4 segments representing the inferred membership fraction in the four subgroups inferred (a). Eighty-six genotypes included in SPPS are highlighted by colored blue bars (b). One hundred and fifty genotypes sampled in A-OMinAll are highlighted by bars: the genotypes included in SPPS are indicated in blue, and the genotypes sampled by the analytical method are indicated in red (c). One hundred and fifty genotypes sampled in A-FNKAll are highlighted by green bars (d).

