Fig. 4.
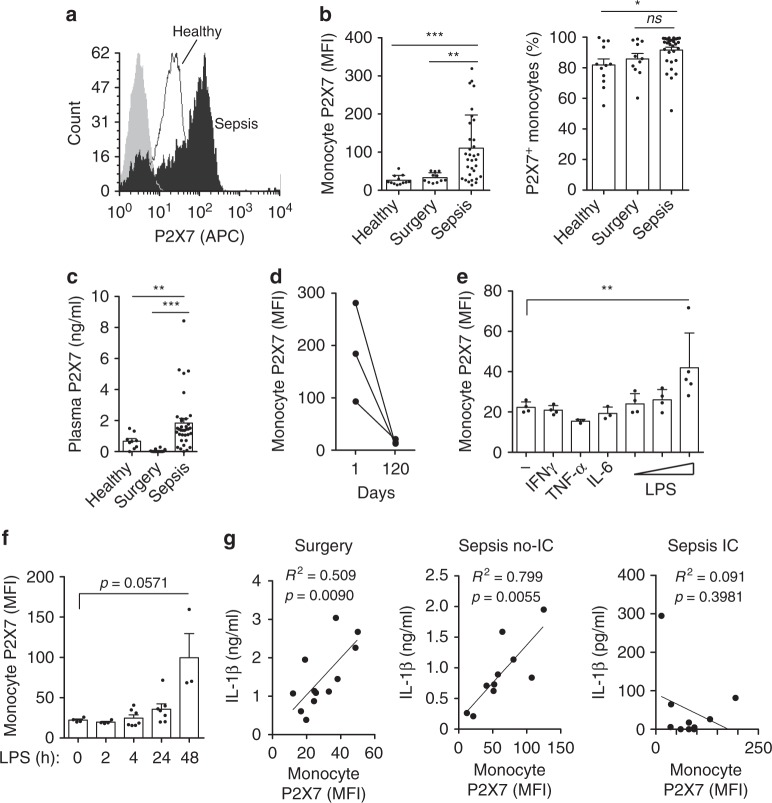
P2X7 receptor is transiently upregulated in monocytes during sepsis. a Representative histogram plot of surface P2X7 receptor staining in monocytes from healthy (white), septic patient (black) and non-stained monocytes (gray). b Quantification of P2X7 receptor mean fluorescence intensity (MFI, left) and percentage of positive monocytes for P2X7 receptor (right) in control and septic patients. c ELISA to quantify the concentration of soluble P2X7 receptor in plasma of control and septic patients. d Quantification of P2X7 receptor MFI at day 1 during sepsis and day 120 after recovery. e Quantification of P2X7 receptor MFI in monocytes from healthy donors treated with IFNγ, TNF-α, IL-6 (all at 20 ng/ml), or with increasing concentrations of LPS (10, 100, 1000 ng/ml) for 24 h. f Quantification of P2X7 receptor MFI in monocytes from healthy donors treated with LPS (1 μg/ml) for the indicated times. g Correlation between the concentration of IL-1β released from PBMCs treated with LPS (1 μg/ml, 2 h) and ATP (3 mM, 30 min), and the quantification of P2X7 receptor MFI in monocytes from the indicated control and septic individuals; IC: immunocompromised septic patients. Each dot represents an individual septic patient or healthy donor; average ± standard error is represented in panels b, c, e, f; exact n number for each panel is presented in Source Data file; *p < 0.05; **p < 0.01; ***p < 0.001; ns, no significant difference (p > 0.05); Kruskal–Wallis test was used in b; Mann–Whitney test for c, e, f; Pearson correlation was used in g

