Fig. 5.
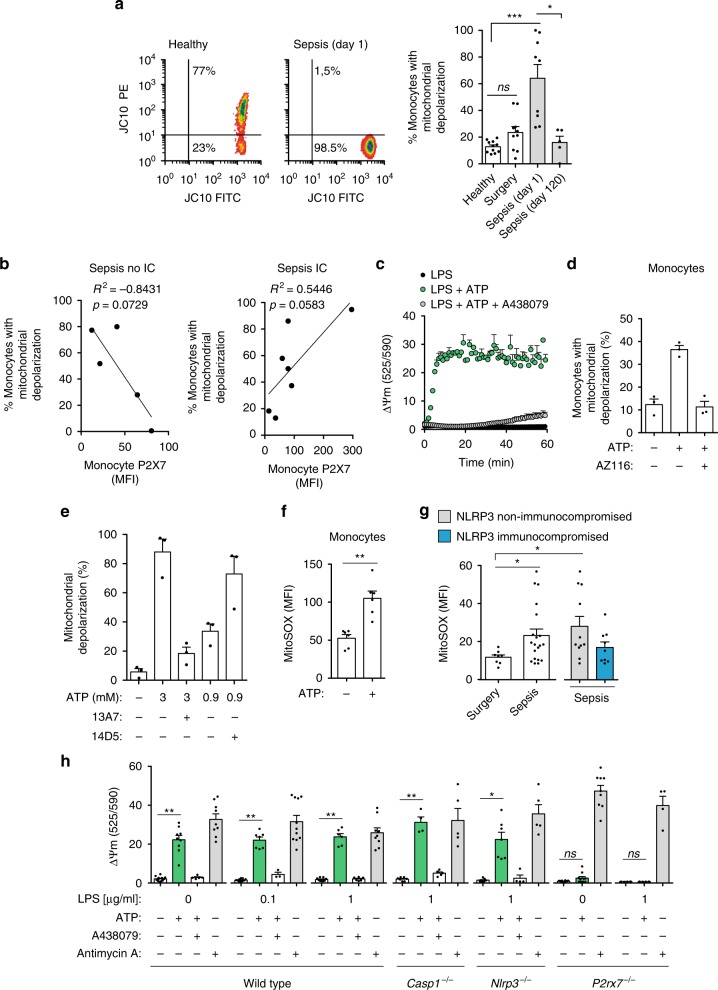
P2X7 receptor induces mitochondrial membrane depolarization. a Mitochondrial membrane potential from blood monocytes stained with JC-10 in a control healthy donor (left), in a septic patient at day 1 (middle), and from healthy controls, abdominal surgery, and septic patients at day 1 or 120 (right); PE− cells represent the monocytes with mitochondrial depolarization. b Correlation between the percentage of monocytes with mitochondrial membrane depolarization and the quantification of P2X7 receptor MFI in monocytes from the septic patients; IC: immunocompromised septic patients. c Kinetics of mitochondrial depolarization after ATP (3 mM) stimulation of LPS-primed BMDMs incubated or not with the P2X7 receptor antagonist A438079 (10 μM). d Percentage of human monocytes from healthy donors with mitochondrial membrane depolarization after ATP (3 mM, 30 min) stimulation and incubated or not with the P2X7 receptor antagonist AZ11645373 (10 μM). e Percentage of mouse BMDMs with mitochondrial membrane depolarization after ATP stimulation at the indicated concentrations for 30 min and incubated or not with anti-P2X7 nanobodies (13A7, blocking nanobody; 14D5, potentiating nanobody; each at 200 nM). f Mitochondrial ROS production from human monocytes isolated from healthy donors after ATP (3 mM, 30 min) stimulation. g Mitochondrial ROS from human monocytes isolated from surgery controls and septic patients (white bar); right bars separate the group of septic patients into NLRP3 non-immunocompromised (gray bar) and immunocompromised (blue bar). h Mitochondrial membrane depolarization from wild-type or knock-out BMDMs as indicated primed or not with LPS (4 h) and treated for 30 min with ATP (3 mM, green bars), ATP and A438079 (10 μM, white bars), or antimycin A (5 μM, gray bars). Each dot represents an individual patient in a, b, g, or an individual healthy donor in d, f, a single independent experiment in e, h, or average + SEM of two independent experiments in c; average ± standard error is represented in panels a (right), c–h; exact n number for each panel is presented in Source Data file; *p < 0.05; **p < 0.01; ***p < 0.001; ns, no significant difference (p > 0.05); Pearson correlation was used in b; Mann–Whitney test was used in f; and Kruskal–Wallis test was used in a, g, h

