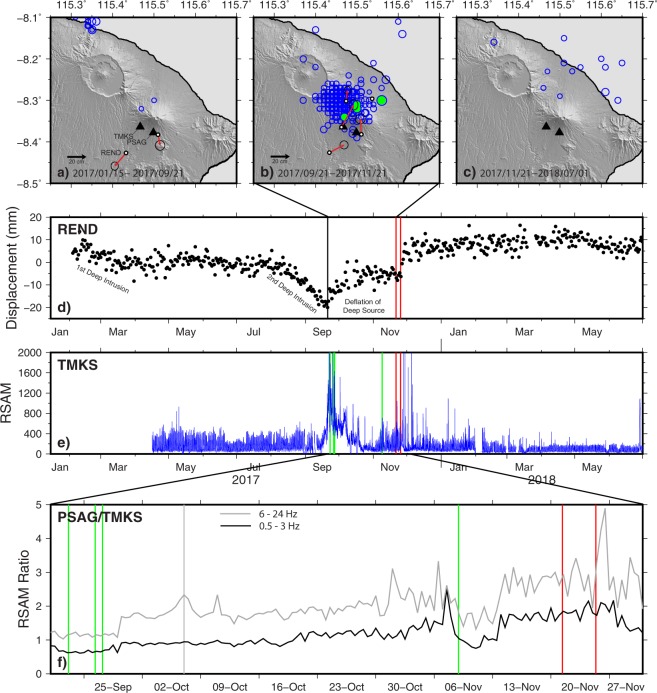
Figure 3.
Regional BMKG Earthquake locations for (A) 2017/01/15 – 2017/09/21, (B) 2017/09/21 – 2017/11/21, and (C) 2017/11/21 – 2018/07/01. Earthquake circle size is scaled by magnitude (range M2.2 to M4.9). Locations are plotted from public data listed to two decimal places, accounting for the gridded appearance. M4+ events are colored green. GPS displacement vectors (small circle is station location: larger circle is approximate error ellipse) demonstrate (A) movement away from the volcano during deep inflation and (B) movement to the N and NE as a result of a combination of dike intrusion and deflation of a deeper source. No clear deformation source was seen in (C). (D) Detailed GPS time-series and (E) RSAM data (1 hour) for stations REND (North) and TMKS, respectively. (F) Frequency filtered RSAM (12 hour) ratios between seismic stations PSAG and TMKS, the two closest stations (4.0 and 5.0 km, respectively) to the Agung summit, which were operating continuously both before and during the seismic crisis. Both instruments are Mark Products L4 seismometers with a one-second period. The frequency bands 0.5–3 Hz (black) and 6–24 Hz (gray) are shown in order to remove a persistent cultural noise source at ~4–5 Hz. Both bands show a general increase in ratio over time approaching the eruption, after which the ratio began to decrease. Green lines in (E),(F) represent times of M4+ earthquakes shown in (B). Red lines in (D)–(F) show timing of the phreatomagmatic eruption onset (21 November) and onset of larger explosions (25 November). The gray line in (F) shows the timing of a large steam emission visible at the summit on 7 October. The abrupt changes prior to this on 29 September are due to changes in analog telemetry. See text and Fig. 1 for other details.

