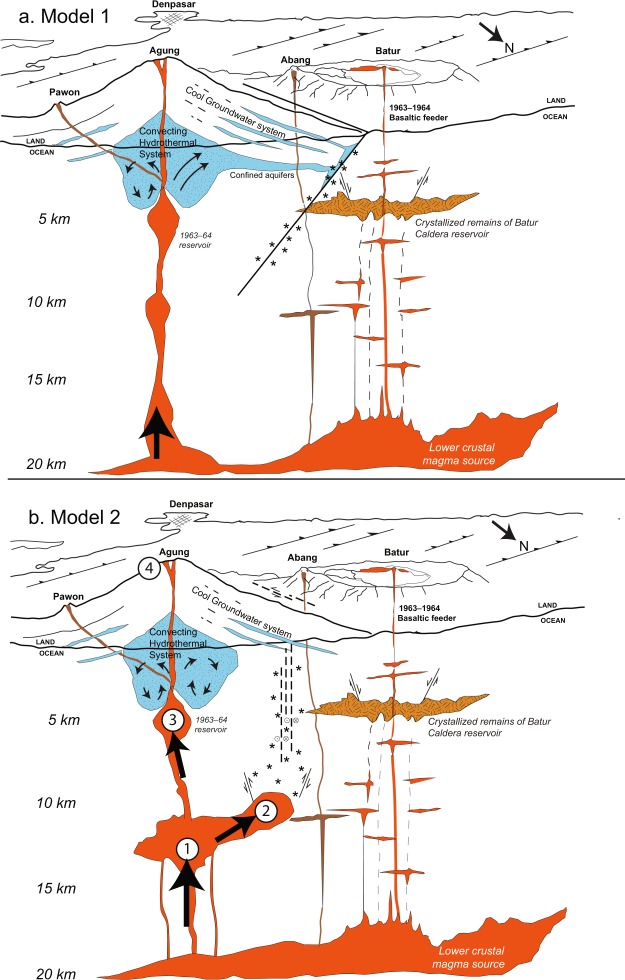
Figure 7.
Conceptual cross-sections representing the magmatic plumbing system along a line parallel to the volcanic vents of Pawon, Agung, Abang and the post-caldera Batur cone. The section trends along a 300-degree compass direction and is projected onto a surface cut parallel to the north coast of Bali island. Because this direction is parallel to the inferred dike, its extent in this 2D section is not representative of dike width or volume. Surface features are based on a Google Earth perspective version of the digital elevation model of eastern Bali. Thrust faults shown on the surface are hypothetical; they are inferred from the structural model of McCaffrey and Nabelek (1987)42. (A) Conceptual cross-section created and used for reference during the volcanic crisis of Agung during October 2017 – January 2018, in which we speculated that magma rising beneath Agung volcano pressurized confined aquifers which in turn activated a pre-stressed fault located between Agung volcano and Batur caldera, resulting in volcano-tectonic earthquakes21. (B) Conceptual cross-section showing our current model of magma ascent beneath Agung. This model includes deep intrusion beneath the Agung edifice and a 300°-trending dike beneath the region between Mount Agung and Batur caldera. Presence of this intrusive dike is based on the interpretation of InSAR data that became available to the CVGHM and USGS response team in February 201810. According to this model, dike intrusion caused uplift as well as the VT earthquake swarms. Fault geometry is inferred based on strike-slip focal mechanisms from earthquake swarms, although some thrust mechanisms along E-W oriented faults were also present. Numbers correspond to stages of magma ascent, as numbered in the discussion section.

