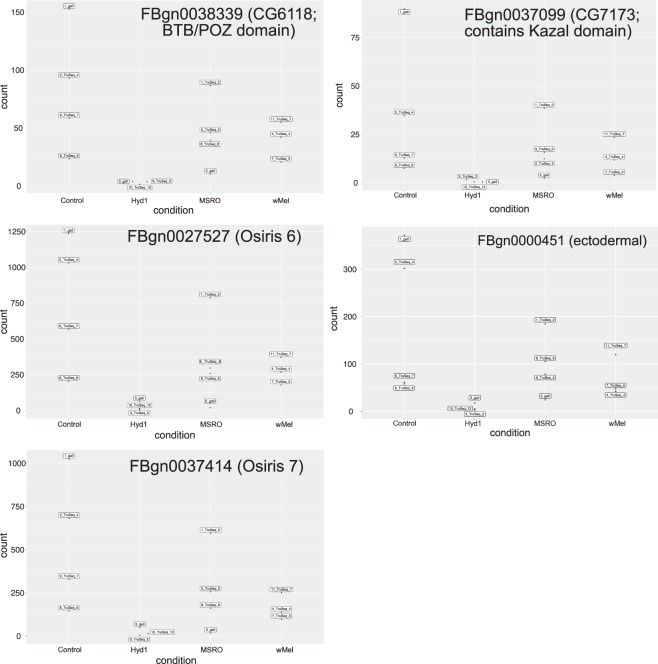
Figure 4.
Normalized counts, as estimated by Deseq2, for the five genes detected as differentially expressed (DE) by a subset of the pipelines (see text and Table 3). The wMel treatment (i.e., Wolbachia-infected) represents the treatment comparable to FlyBase-reported expression values. Nonetheless, the RPKM values reported by FlyBase (and presented in Table 4) are not directly comparable to our normalized counts, for the equivalent treatment.

