Fig. 4.
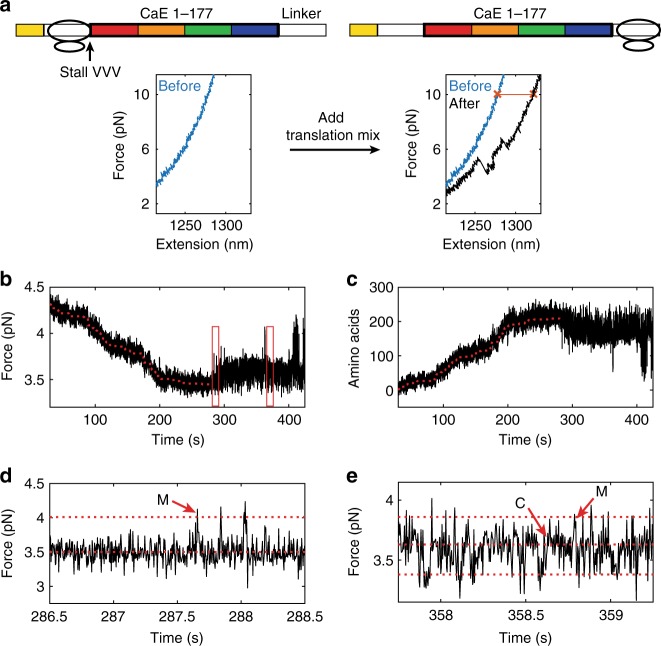
Set-up for real-time elongation OT experiments. a The sequence for stalling and restart. RNCs were stalled at a three-valine repeat (see Supplementary Fig. 5) and restarted with the addition of translation mix in the OT (Supplementary Table 3). The force–extension curves show the lengthening of the tether after translating (red line denotes difference between blue and black force–extension curves) as well as folding of the full-length protein, which confirms the ribosome reached the end of the mRNA. b An example of ribosome translating. As each amino acid is added, the force decreases as the tether gets longer. The fit is shown as a red dotted line. c The trajectory is converted to amino acids using a worm-like-chain model. d A zoom of the panel in b that shows the folding region. The red arrows show the misfolded state and the dotted line the expected size for state M. e A zoom of the panel in b that shows the folding region later in time. At this point, both C and M are accessible (dotted lines show expected sizes, arrows mark some the transitions). Representative molecule from n = 12. Source data are provided as a Source Data file

