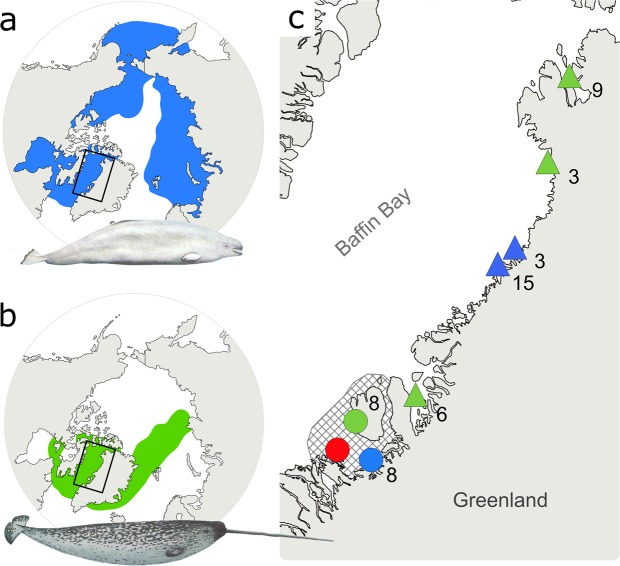
Figure 1.
Distribution ranges of (a) belugas and (b) narwhals, and (c) insert map of sampling localities of the beluga (blue) and narwhal (green) used in the study. Circles represent tissue samples used in the genomic analyses, triangles represent the skulls used in the stable isotope analysis. The collection site of specimen MCE1356 is indicated with a red circle. Sample sizes at each locality are indicated. Hatched grey area in Fig. 2c represents Disko Bay and adjacent waters. Whale illustrations in (a) and (b) by Larry Foster.

