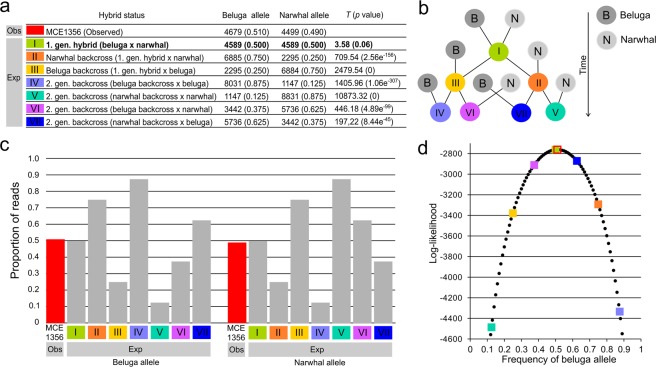
Figure 5.
Distribution of reads in MCE1356 at 9,178 polymorphic sites fixed for altering alleles in reference panel belugas and narwhals. (a) Observed number of MCE1356 reads matching the beluga allele and narwhal allele, and expected number of reads matching the beluga allele and narwhal allele under seven hybridization scenarios (I–VII). T values from Pearson’s Chi-square goodness of fit statistic, where MCE1356 is the observed and the seven different hybridization scenarios are used to compute the expected read counts. The only hybridization scenario that could not be rejected is presented in bold. (b) Schematic illustration of the seven hybridization scenarios. (c) Observed proportion of reads matching the beluga allele and the narwhal allele in MCE1356 and the expected proportions matching the beluga allele and the narwhal allele under seven different hybridization scenarios. (d) Log-likelihood of b, the proportion of beluga ancestry in MCE1356, across its whole range (see Equation 5 in main text) and the log-likelihoods of the seven different hybridization scenarios. The seven hybrid scenarios are represented by colored squares with colors matching 5a, MCE1356 is represented in red.

