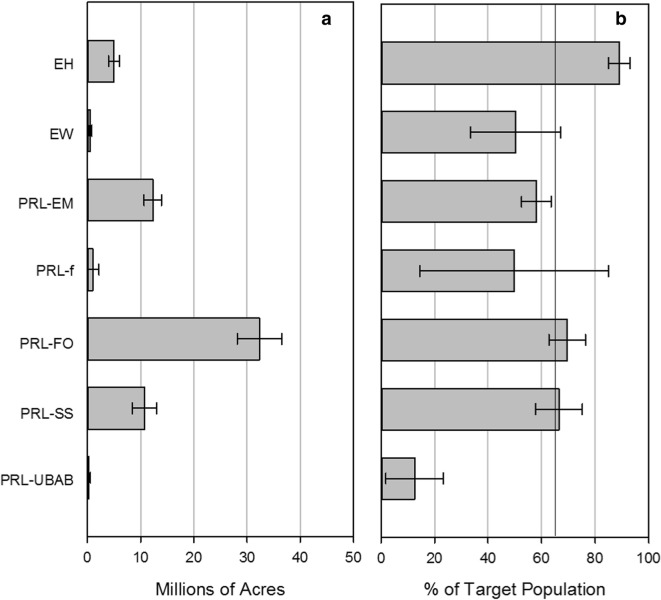
Fig. 3.
The area of the NWCA 2011 sampled population by wetland type (millions of acres) (a) and as a percent of the target population (b). See Table 1 for definitions of acronyms. The vertical line in panel b indicates the percent of the target population that could have been sampled if there were no issues with accessibility or in the field that prevented sampling a site. Error bars are 95% confidence intervals

