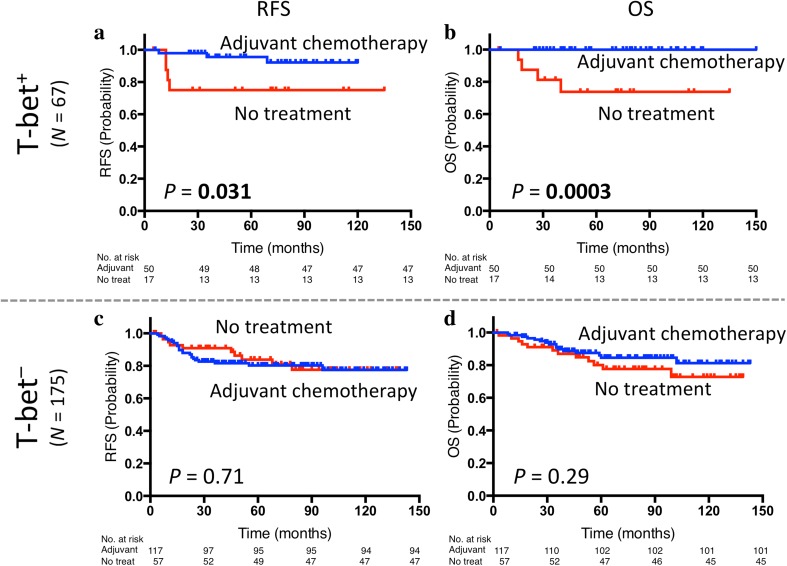
Fig. 3.
Prognostic value of adjuvant chemotherapy by T-bet: Kaplan–Meier curves showing estimated RFS (a) and OS (b) for treatment status in T-bet-positive tumors as well as RFS (c) and OS (d) for treatment status in T-bet-negative tumors. p values are for comparison of two groups. Adjuvant adjuvant chemotherapy, No treat no treatment

