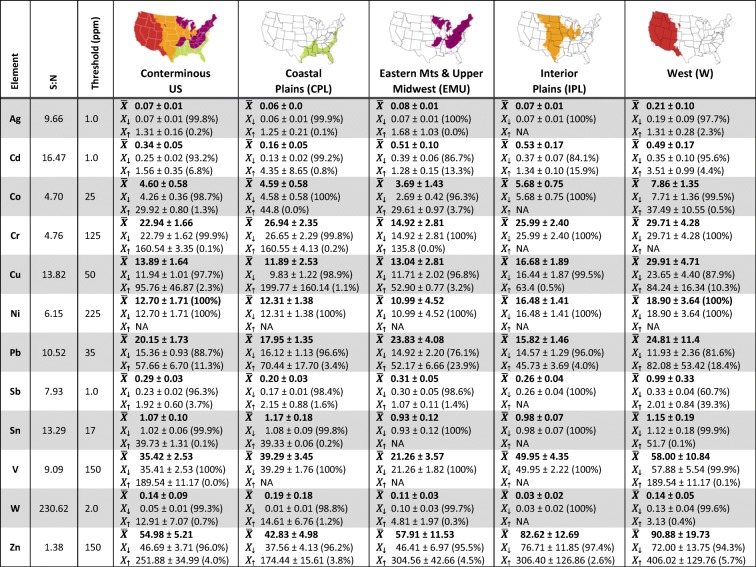
Table 3.
For each of the 12 measured elements, the signal-to-noise ratio (S:N), the background concentration threshold (ppm), and mean concentration (ppm) ± 95% confidence interval (CI) in the uppermost horizon with soil chemistry. Concentrations are expressed as population means for all probability sites and for probability sites with heavy metal concentrations below (X↓) and above (X↑) the background concentration threshold. Percent of the population is in parentheses for X↓ and X↑, with representing the 100% of the sampled population. NA signifies that there were no sites with heavy metal concentrations above the threshold. Areal extent (ha) and number of sites associated with each mean are reported in Supplementary Table 1

