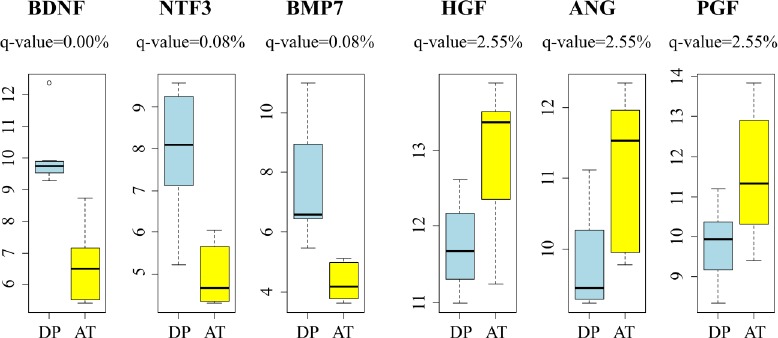
Figure 2: Representative genes differentially expressed between DP-hMSCs and AT-hMSCs.

Expression levels of representative genes for DP-hMSCs (n=7; DP; light blue) and AT-hMSC (n=6; AT; yellow) are displayed. Note that the y-axes indicate the log2 values of arbitrary expression readouts. The q-values are based on the SAM analysis. BDNF: brain derived neurotrophic factor; NTF3: neurotrophin 3; BMP7: bone morphogenetic protein 7; HGF: hepatocyte growth factor; ANG: angiogenin; PGF: placental growth factor.
