Figure 1.

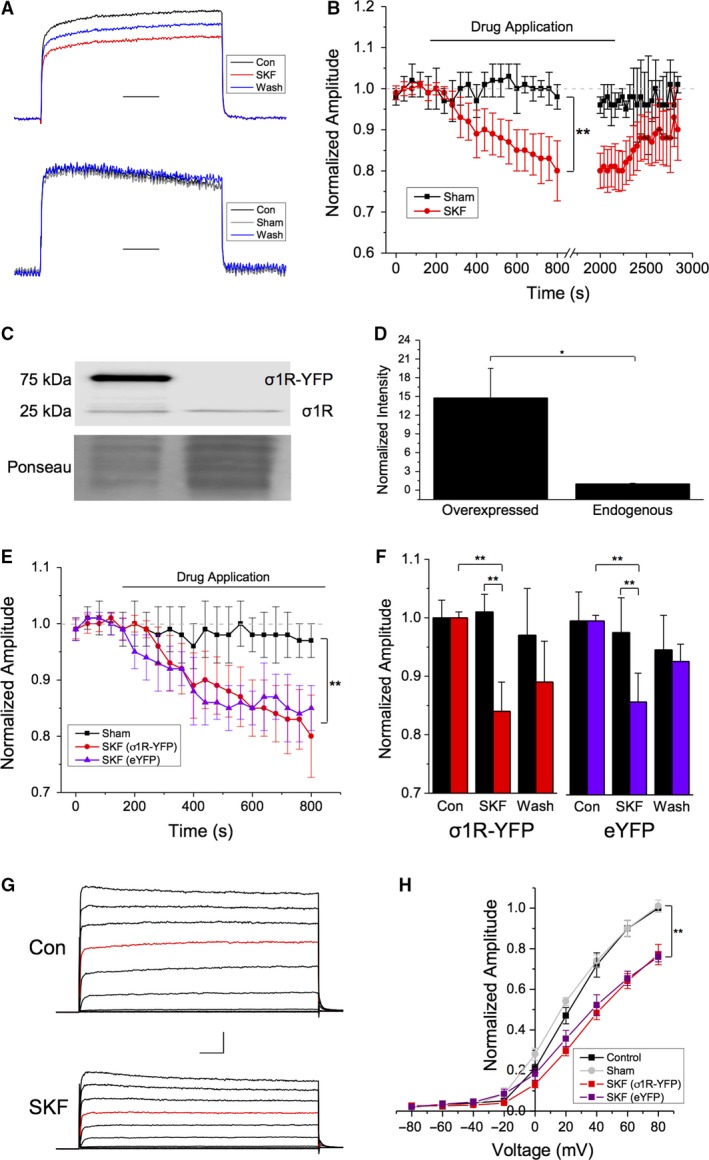
Bath application of the Sig‐1R agonist SKF‐10,047 decreases Kv1.2 current amplitude. (A–B) Representative voltage‐clamp traces showing normalized Kv1.2 channel current evoked by a 1 sec depolarizing step from −80 to +20 mV in the absence (black) and presence (red) of SKF 10,047 (SKF) and following SKF washout (blue). Scale bar is 200 msec. Sham drug applications had no effect on current amplitude, which showed no significant rundown over the course of the experiment (B, black). Administration of SKF resulted in a ~30% decrease in current amplitude (B, red) which was partially reversible upon washout. (C) Representative Western blot showing the protein level of Sig‐1R in HEK293 cell lysates following transient transfection of Sig‐1R‐YFP compared to endogenous Sig‐1R. (D) Densiometric quantification and normalization of the band intensities to a Ponseau stain revealed a ~40 × increase in Sig‐1R levels when Sig‐1R‐YFP was overexpressed. (E–F) Overexpression of the Sig‐1R had no additional effect on the decrease in Kv1.2 current amplitude observed in the presence of SKF (E, red vs. purple traces; F, red vs. purple bars). (G) Representative traces from a current‐voltage (IV) plot obtained in control (top) and SKF conditions (bottom), from −80 to +80 mV in 20 mV increments. The step to +20 mV is shown in red for clarity. (H) There was a significant decrease in current amplitude at all voltages greater than 0 mV in the presence of SKF in cells overexpressing Sig‐1R (H, red trace) and in cells with endogenous levels of Sig‐1‐R expression (H, purple trace). The IV response to sham cells was not significantly different from control (H, gray trace). Scale bar is 100 msec and 200 pA. Data are expressed as mean ± 95% CI. Asterisks indicate statistical significance; single asterisks (*) represent P < 0.05, while double asterisks (**) indicate P < 0.005.
