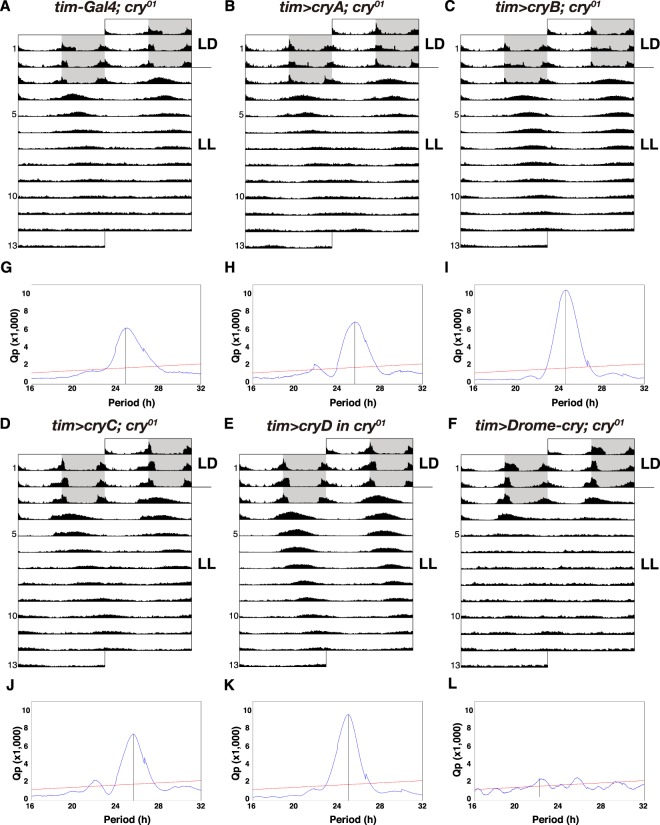
Figure 4.
Behavioural analysis of circadian rhythm conservation between Dapma-CRYs and Drome-CRY. (A–F) Actogram showing the average locomotor activity of control (tim62-Gal4/+; cry01/cry01, n = 29, A), each Tim-Dapma-CRY (tim62-gal4/UAS-Dapma-cryA; cry01/cry01, n = 29, B; tim62-gal4/UAS-Dapma-cryB; cry01/cry01, n = 29, C; tim62-gal4/UAS-Dapma-cryC; cry01/cry01, n = 29, D; tim62-gal4/UAS-Dapma-cryD; cry01/cry01, n = 30, E) and Tim-Drome-CRY (tim62-gal4/UAS-Drome-cry; cry01/cry01, n = 29, F) flies. Individual male flies were entrained under a 12-h:12-h LD cycle for 3 days and then monitored under LL conditions for 10 days. Grey shading indicates the dark phase during LD. (G–L) The chi-squared periodogram of control (G), each Tim-Dapma-CRY (H–K) and Tim-Drome-CRY (L) flies. The periodograms were obtained using records of LL conditions. The longitudinal line in each periodogram indicates the highest peak that crosses the line of significance. An oblique line in the χ2 periodogram indicates a significant level of p = 0.05.

