Fig. 2.
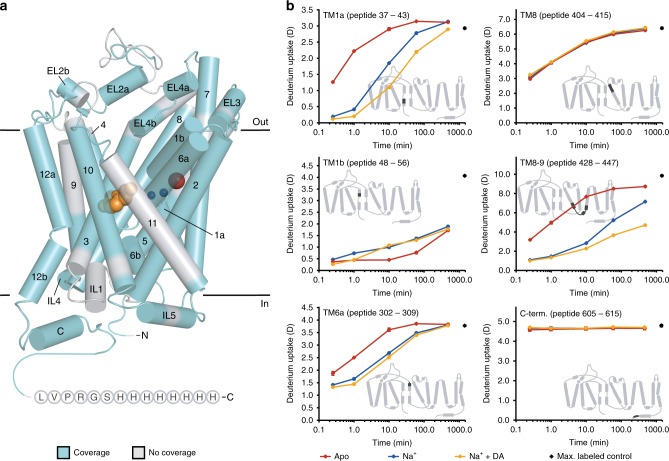
HDX of local regions of dDAT in different functional states. a Cylindrical representation of the crystal structure of dDAT in complex with two Na+ ions (blue spheres), one Cl− ion (red sphere) and DA (orange spheres) (PDB ID: 4XP1). To obtain information about HDX of local regions of dDAT, we digested the transporter enzymatically and identified the generated peptides using MS. Regions of dDAT covered by identified peptides are highlighted in cyan. Wild-type dDAT was used for the HDX-MS experiments, however, the crystal structure shown has truncated N- and C-termini and deleted part of EL2. The C-terminal His-tag used for purification of the wild-type dDAT is added to the structure as circles with one-letter codes. b Deuterium uptake is plotted as a function of labeling time (i.e., 0.25–480 min) for representative peptides of dDAT. Red, blue, and orange curves illustrate the deuterium uptake for dDAT in the apo, Na+-bound, and Na+ + DA-bound state, respectively. Values represent means of three (apo and Na+ + DA) or six (Na+) independent measurements. Standard deviations are plotted as error bars but are in most instances too small to be visible. Maximum-labeled control samples are shown as black circles at 1440 min. Insets: The location of the corresponding peptide is highlighted in black on the topology map of dDAT. Source data are provided as a Source Data file

