Figure 1.
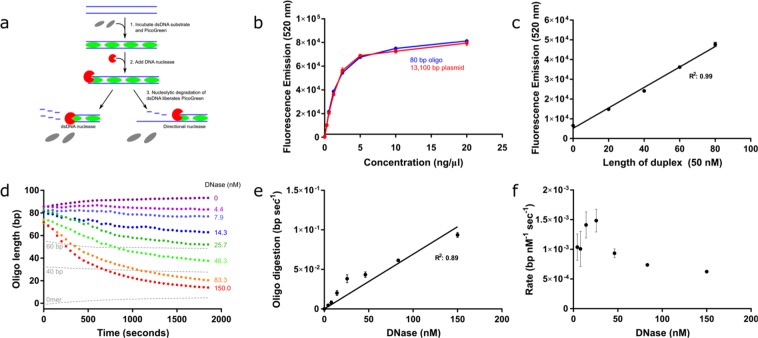
Optimisation of the fluorescence signal and assay parameters. (a) Schematic depicting the method by which PG (green) intercalates with dsDNA (blue) to emit a fluorescent signal. Digestion of this PG:DNA complex by nucleases (red) disrupts the duplex structure and causes a concomitant reduction (grey) in signal that can be measured in real-time. (b) Calibration curve indicating the fluorescent signal emitted by increasing concentrations of 80 bp dsDNA and 13.1 kb plasmid DNA. (c) Standard curve composed of 80, 60, 40 and 20 bp sequences. The point shown at 0 on the x-axis is an 80-nt ssDNA oligomer to represent the end product of complete resection. (d) DNase I titration on an 80 bp dsDNA substrate. Dotted grey lines represent controls containing standard duplexes of intermediate sizes. (e) Extracted maximum gradient from (d) to determine the reaction rate at increasing concentrations of DNase I. (f) Maximum rate analysis of resection per nM DNase I per second. Error bars represent SEM; n = 3 in all cases.

