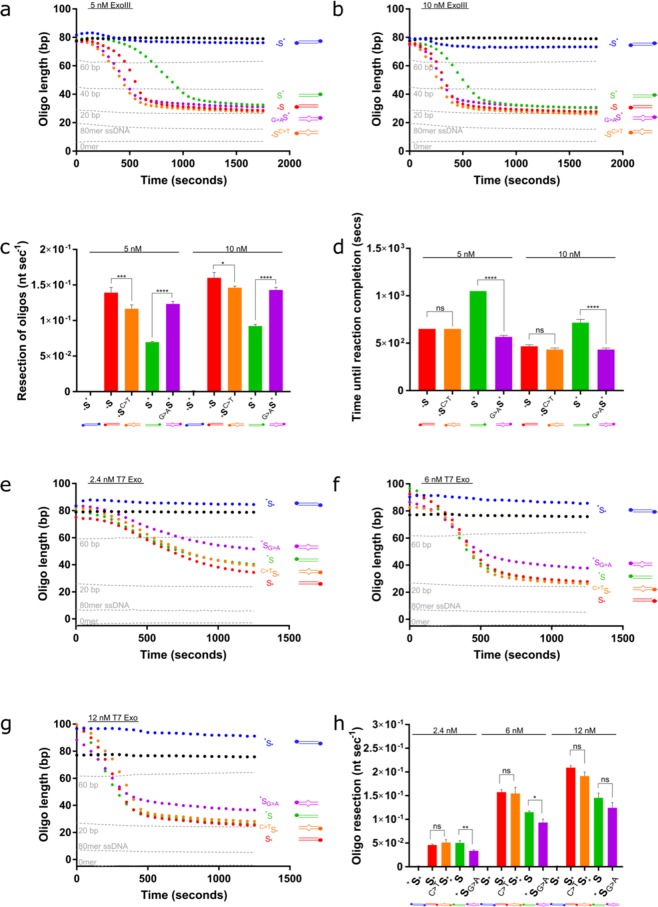
Figure 4.
ExoIII and T7 Exo resect through single-nucleotide mismatches. (a) 5 nM and (b) 10 nM ExoIII was added to perfectly matched substrates (*S and S*) and substrates containing four T:G or A:C mismatches, (*SC>T and G>AS*, respectively), and the resection reaction followed. Standard curve is represented by the grey dotted lines. (c) Calculated resection rate of ExoIII on the complementary and mismatched substrates based on maximum gradients in (a) and (b). (d) Time (seconds) until the ExoIII reaction reaches completion based on the point at which the reaction plateaus. (e) 2 nM, (f) 7.5 nM and (g) 10 nM T7 Exo was added to complementary substrates (S* and *S) and substrates containing four T:G or A:C mismatches (C>TS* and *SG>A, respectively). Standard curve is represented by the grey dotted lines. (h) Calculated resection rate of T7 Exo on the complementary and mismatched substrates. Error bars represent SEM; n = 3 in all cases; *p < 0.05, **p < 0.01, ***p < 0.001, ****p < 0.0001.

