Figure 2.
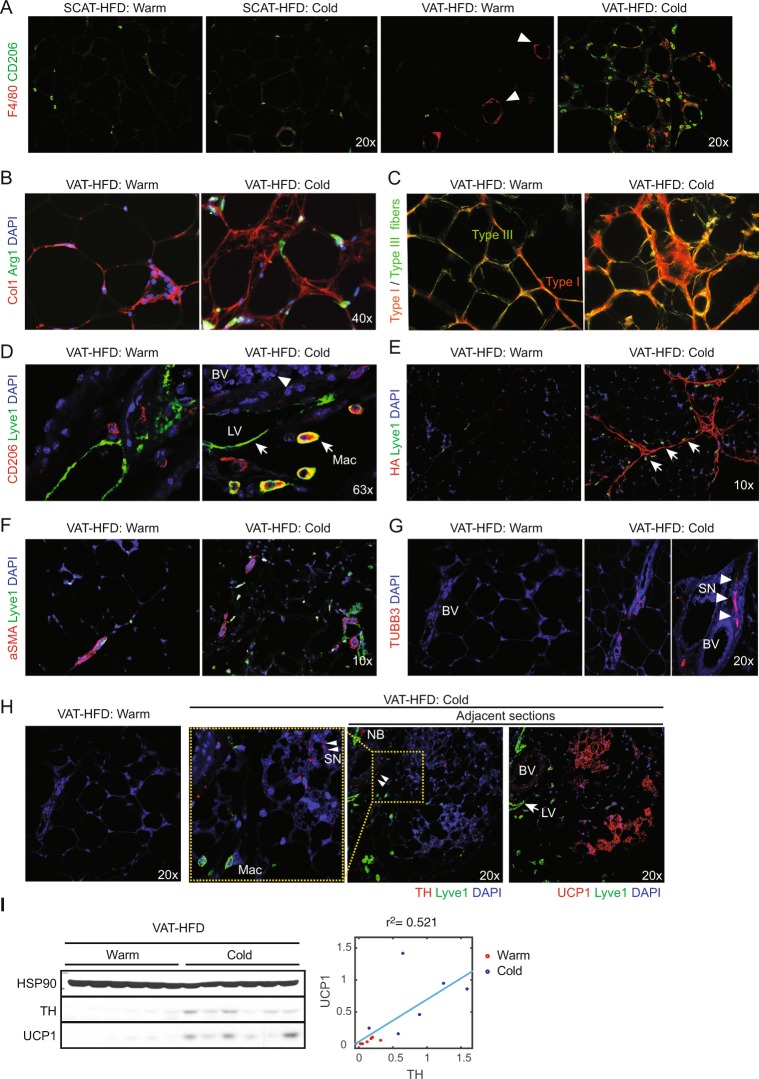
Cold exposure induces VAT remolding in obese mice. HFD-fed mice were maintained at 30°C (Warm) or exposed to 4°C for 10 days (Cold) as indicated in Fig. 1A. Representative IF in HFD-fed SCAT (A) and VAT (A–H) were shown. (A) CD206 (green) and F4/80 (red) IF. CLS are indicated by triangles. (B) Collagen I (red) and Arg1 (green) IF. (C) Picro Sirius Red staining imaged with polarized light microscopy, visualizing collagen fibers type I (thick fibers, yellow-orange) and type III (Thin fibers, green). (D) CD206 (red) and Lyve1 (green) IF. Red blood cells (arrow), Lyve1+ ATM2 (Mac), Lyve1+ lymphatic vessels (LV) are indicated. (E) Hyaluronan fibers (HABP-stain, red) and Lyve1 (green) IF. Arrows indicate ATM2 (F) aSMA (red) and Lyve (green) IF. (G) TUBB3 (red) IF. Sympathetic nerves (SN) are indicated by triangles, surrounding blood vessel (BV). Higher magnification image is shown at side. (H) Lyve1 (green) and TH (left) or UCP1 (right) (red) IF in adjacent sections (right two). Higher magnification images of the inlets (yellow dashed boxes) are also shown at left side. Note TH+ nerves (triangles) were closely associated with beige adipocytes (red) and blood vessels (BV). NB, nerve bundles. DAPI (blue) stains cell nuclei. For each IF analysis, at least 10 independent mice per group were examined, and representative images are shown. (I) Western blot analysis for TH, UCP1, and HSP90 (loading control). At right, quantified TH and UCP1 expression are plotted to show correlation.

