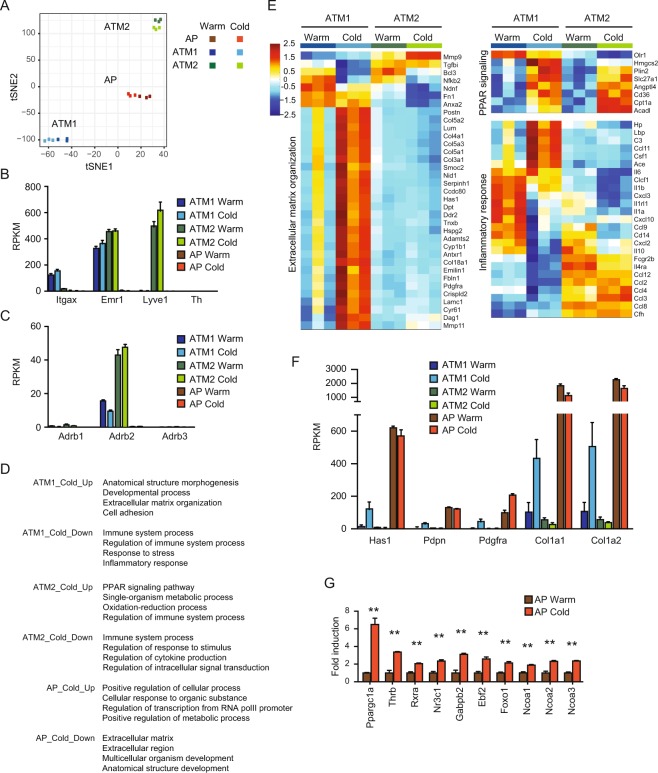
Figure 4.
ATM and AP gene expression after cold exposure. Gene expression analysis in obese VAT ATM and AP: HFD-fed mice were maintained at 30°C (Warm) or acclimated at 18°C for 7 days before exposure to 4°C for 8 days (Cold). ATM1, ATM2 and AP were FACS sorted from VAT for RNA-Seq analysis. (A) tSNE analysis. (B) The expression of Itgax, Emr1, Lyve1, and Th. (C) The expression of adrenergic receptor genes. (D) Gene Ontology (GO) enrichment analysis of differentially expressed genes between warm and cold conditions in ATM1, ATM2, and AP. (E) Heatmap showing ATM expression of various genes in indicated GO pathways (ECM organization: GO 0030198; PPAR signaling pathway: KEGG 03320; Inflammatory response: GO 0006954). For expression heatmaps, data (log2(RPKM)) are standardized along each gene (row), and color scale corresponds to the relative expression level. (F) Expression of ECM-related genes that were regulated by cold-exposed in ATM1. (G) Induction of transcription activator genes implicated in beige/brown adipogenesis in AP. **P < 0.01 by Student’s t-test. Data are shown as mean ± SEM (N = 3 samples, 3 mice pooled as one sample).

