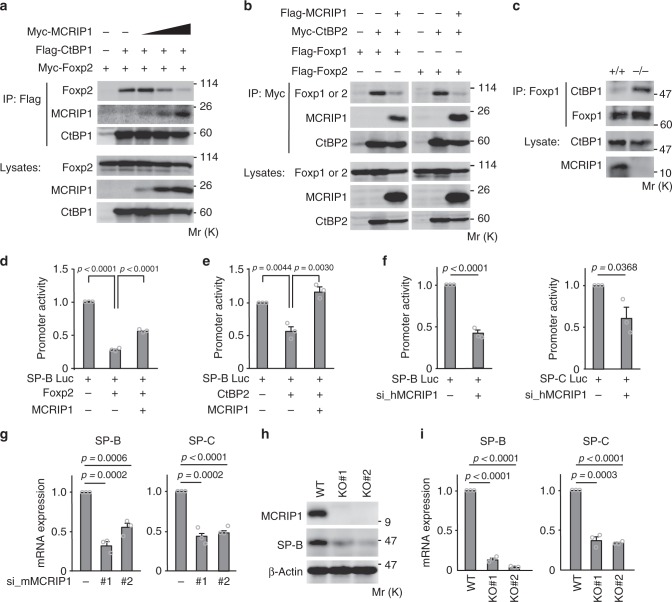
Fig. 4.
MCRIP1 promotes the expression of SP-B and SP-C by disrupting the CtBP-Foxp interactions. a, b MCRIP1 inhibits Foxp-CtBP interactions. U2OS cells were transiently transfected as indicated. a Flag-CtBP1 was immunoprecipitated, and co-precipitated Myc-MCRIP1 and Myc-Foxp2 were probed with an anti-Myc antibody. Increasing amounts of Myc-MCRIP1 expression vector were used. b Myc-CtBP2 was immunoprecipitated, and co-precipitated Flag-MCRIP1, Flag-Foxp1, or Flag-Foxp2 were probed with an anti-Flag antibody. c Co-precipitation of endogenous CtBP1 and Foxp1 in lung lysates from Mcrip1+/+ and Mcrip1−/− mice. Endogenous Foxp1 was immunoprecipitated and co-precipitated CtBP1 was detected by immunoblotting. a–c The levels of protein expression are shown in the lower rows. d, e MCRIP1 inhibits the repression of the SP-B promoter induced by Foxp2 d or CtBP2. e A549 cells were transfected with the SP-B-luciferase reporter plasmid (SP-B Luc) and the pMCRIP1 plasmid, together with pFoxp2 d or pCtBP2 e as indicated, and SP-B promoter activity was analyzed (fold induction). f SP-B and SP-C promoter assays. A549 cells were transfected with siRNA targeting human MCRIP1, cultured for 48 h, and then re-transfected with SP-B-Luc or SP-C-luciferase reporter plasmid (SP-CLuc). After an additional 48-h incubation, SP-B, or SP-C promoter activities were analyzed. d–f Data are means ± SEM from three independent experiments performed in triplicate. g MCRIP1 siRNA-mediated depletion decreases the mRNA expression of SP-B and SP-C. MLE12 cells were transfected with siRNAs targeting mouse Mcrip1 (#1 or #2). Total RNA was then extracted and analyzed for endogenous SP-B (left) or SP-C (right) mRNA expression (fold change) using qRT-PCR. h, i Mcrip1-KO MLE12 cells were established using the CRISPR/Cas9 approach with two different guide RNAs (KO#1 or KO#2). h The expression levels of endogenous MCRIP1 and SP-B proteins were analyzed by immunoblotting. β-actin, loading control. i The expression levels of SP-B and SP-C mRNAs were analyzed using qRT-PCR. g, i The data represent the mean ± SEM from three independent experiments

